(What Consumers Need to Know for the 2026 Marketplace)
D. Kenton Henry – editor, agent, broker
As we approach the 2026 plan year, one of the biggest questions in individual and family health insurance is what will happen to Advance Premium Tax Credits (APTCs)—the subsidies that lower monthly premiums for millions of Marketplace enrollees.
Why This Is Happening
During the COVID era, Congress passed temporary legislation — most recently extended under the Inflation Reduction Act (IRA) — which made Marketplace subsidies more generous and available to more households. These enhanced subsidies are scheduled to expire at the end of 2025, unless Congress acts to extend them.
If they expire, the Marketplace will revert to pre-COVID subsidy rules, which means:
1. Lower income thresholds for subsidy eligibility
Some households who qualified for subsidies under the temporary rules will no longer qualify at all.
2. Smaller subsidies for many who remain eligible
People who received very large subsidies during 2021–2025 would see higher net premiums for 2026, even if their income has not changed.
3. The return of the “subsidy cliff”
Under pre-COVID rules, households with income even slightly above 400% of the Federal Poverty Level received no subsidy. The COVID-era rules removed that cliff. If not renewed, the cliff returns.
This is why some people are seeing early projections showing their 2026 premiums rising sharply.
Where Things Stand in Congress
Both parties publicly acknowledge that the expiration would lead to large premium increases for many families. As of today:
There is broad interest in finding a solution, but
No final legislation has been passed,
No guarantee exists that the enhanced subsidies will continue, and
Any resolution will likely be tied to larger budget negotiations.
In short: Congress is still debating it, and the outcome directly affects what consumers will pay for Marketplace coverage in 2026.
What Consumers Should Expect
Until Congress acts, the Marketplace must begin preparing 2026 rates under the assumption that the enhanced subsidies expire. This means:
Preliminary quotes may show dramatically higher net premiums
Some currently subsidized families may temporarily appear ineligible for assistance
Final 2026 subsidy amounts cannot be known until legislation is passed — if it is passed
It is important to remember that this may change, depending on Congressional action in the coming months.
Practical Guidance for Individuals and Families
Don’t panic if early projections show large increases.
Stay informed — subsidy rules may be extended or modified.
Review your 2026 options with a licensed, experienced broker who can calculate subsidies under both scenarios.
Update income estimates accurately during Open Enrollment; small changes can affect substantial tax credit differences.
Bottom Line
The enhanced ACA subsidies that helped make Marketplace coverage more affordable since 2021 are set to expire after 2025, and Congress has not yet determined whether they will be renewed. Until a resolution is reached, 2026 Marketplace premiums may appear significantly higher for many Americans.
I will continue to monitor developments closely and provide updates as soon as new information becomes available.
Additionally—
It has come to my attention that my clients have been told the First Health PPO network plan is being mistakenly interpreted by them as being an Affordable Care Act (ACA) compliant PPO network. As such, they incorrectly believe any and all of their pre-existing health conditions will be covered and that all preventive exams and medicine will be covered at no out-of-pocket cost to them. This is wrong and here is the truth, as confirmed by me and ChatGPT:
✅ 1. There are no ACA-compliant PPO plans available in Texas individual/family (On- or Off-Exchange)
Texas has not had a true ACA-compliant individual market PPO option for several years. All carriers (BCBSTX, Ambetter, United/Optum, Aetna CVS, Oscar, Cigna, Moda, etc.) offer only:
EPOs
HMOs
These networks limit out-of-network benefits and require referrals or tighter network management.
A PPO requires:
National or multi-state contracted provider access
True out-of-network benefits
No referral requirement
No carrier has offered this in the ACA individual Texas market since around 2017–2018.
✅ 2. Aetna is not selling ACA individual/family plans in Texas for 2026 (and has already exited)
Your clients may be confused because Aetna offers:
Medicare Advantage PPOs
Employer-based PPOs
First Health networks tied to group/other products
But Aetna does NOT offer ACA individual/family plans in Texas for 2026.
So if someone believes they have an “Aetna PPO” under an ACA plan, they are mistaken. It is either not an ACA plan, or they are misinterpreting the network type.
✅ 3. If their plan is marketed as “PPO-like,” it is almost certainly:
a) A short-term medical plan
These frequently use PPO networks—including Aetna’s First Health—but they are:
NOT ACA-compliant
Do NOT cover pre-existing conditions
Can cap benefits
Can deny claims based on underwriting
b) A health-sharing ministry
Often marketed as “PPO plans” because they use rented networks, but also:
Not insurance
Not regulated as insurance
No claim guarantees
No ACA protections
c) A fixed-benefit plan that uses First Health or MultiPlan PPO
Again:
Not insurance
No ACA protections
No out-of-pocket maximums
No guaranteed coverage
d) A direct primary care + medical indemnity bundle
These are sometimes misrepresented as “PPO plans,” but they are not.
✅ 4. How to confirm instantly whether the client is on ACA-compliant coverage
Ask for one of the following:
A) The name of the carrier.
If it’s not:
BCBSTX
Cigna
Ambetter
UnitedHealthcare (UHC Marketplace)
Aetna CVS (in some states, but NOT Texas 2026)
Moda
Oscar (until exit)
…then it’s almost certainly not ACA-compliant.
B) A copy of the Summary of Benefits & Coverage (SBC).
All ACA plans must include an SBC — short-term plans and sharing ministries do not.
C) Their monthly bill or ID card.
If it says things like:
First Health Network
MultiPlan PPO
PHCS PPO
Aetna PPO
United Healthcare Choice/Choice Plus PPO
…that is almost certainly a non-ACA plan.
✅ 5. Bottom line for you:
If you believe you they are on an ACA-compliant “Aetna PPO” for individual/family coverage:
You are not. No such product exists in the Texas ACA market. You are almost certainly on a short-term plan, health-sharing product, or fixed-benefit plan using a rented PPO network.
This is an excellent opportunity for ne to help you transition to true ACA coverage, where you will regain:
Pre-existing condition protection
Essential health benefits
No annual/lifetime caps
And – perhaps most importantly – Out-of-pocket maximum protection
Please feel free to call me with any questions you may have or for assistance in obtaining 2026 ACA compliant health insurance. I will make the quoting and application process go as quickly and smoothly as possible whether you quailify for a subsidy or not.
The Open Enrollment Period for a January 1 effective date ends December 15th. You have until January 15th to obtain an effective date of February 1.
D. Kenton Henry Office: 281-367-6565 Text my cell 24/7@ 713-907-7984 Email: Allplanhealthinsurance.com@gmail.com
By D. Kenton Henry, Editor / Agent / Broker — TheWoodlandsTXHealthInsurance.com, AllPlanHealthInsurance.com, HealthandMedicareInsurance.com 30 October 2025
Each November in Texas marks more than just the start of the new health insurance year—it’s your gateway to securing coverage for the year ahead. This time around, the 2026 individual and family health insurance market is undergoing noticeable changes. Here’s what you need to know—and how you can be ready.
1. Why 2026 matters
Open enrollment for 2026 policies begins November 1, 2025, and runs until January 15, 2026 for most Texas consumers. If you don’t act in this window, you could be locked out of making changes until next year unless a qualifying life event occurs. Given major shifts among carriers and plan options, early action is more important than ever.
2. Carrier changes you should track
One of the major headlines: Aetna will exit the Texas individual and family market beginning in 2026. That means if you currently have an Aetna plan, your policy will not renew for 2026. You’ll need to select a different carrier in the upcoming enrollment period.
Other carriers are repositioning their offerings, adjusting networks, benefits, and rates. Even if your carrier is staying, plan names and design may change. As your broker, I’ll review all available options from multiple carriers and ensure you’re not simply renewing by default.
3. What this means for you
No automatic renewal: If your carrier exits the market, your current plan will not carry over. You’ll receive a Notice of Change—or termination—and need to select a new plan.
Shop your options: Differences between plans are not only about monthly premiums. Review networks, cost-sharing, deductibles, out-of-pocket maximums, and whether benefits match your healthcare needs.
Subsidy changes: The federal subsidy rules continue to evolve. Even small changes in income, household, or eligibility can shift your subsidy level. I’ll help you analyse eligibility for Advance Premium Tax Credits (APTC) and other cost-saving tools.
Timing matters: Beginning November 1, I’ll be available to assist you through the selection process—not just on carriers and plans, but on ensuring accurate enrollment to avoid coverage gaps.
4. Why working with a broker matters
As an independent broker specializing in medical insurance since 1986, I work with virtually every major carrier licensed in Texas. My services to you are free of charge. My goal is to ensure you get the best plan that fits your health needs, budget, and preferences—especially in a year of significant market change. Rather than navigating dozens of plan names on your own, let me do the heavy lifting and help you make an informed choice.
5. What to do now
Gather your information – your current health plan, recent premium receipts, summary of benefits, and any health changes.
Schedule your review – open enrollment kicks off November 1. If you’d like early preparation, I’m available now to pre-review your situation so you’re ready to act.
Act during the window – November 1 through January 15 is your open period. Plans go into effect January 1, 2026, or, depending on carrier rules, as early as December 1, 2025.
Don’t wait – with carrier exits and plan redesigns in motion, the sooner you start the review, the better your chance of finding the optimal match.
Working together, we’ll turn these market shifts into an advantage—so instead of scrambling when notices arrive, you’ll move confidently into 2026 with coverage aligned to your needs.Let me handle the complexity so you can focus on your life, your health, and your goals.
If it’s after hours, or you simply prefer, you can do preliminary research before calling me by obtaining quotes from my quoting engine. You do NOT have to log in to obtain them but be certain to call me afterwards with questions, and assistance in finding your providers within the networks, as well as applying. CLICK HERE: https://allplaninsurance.insxcloud.com/get-a-quote
D. Kenton Henry Editor · Agent · Broker TheWoodlandsTXHealthInsurance.com * AllPlanHealthInsurance.com * HealthandMedicareInsurance.com
D. Kenton Henry Editor, agent, broker 30 SEPTEMBER 2025
Medicare 2026: Welcome clients and prospective clients! Before reading this (if you have not already), you should go to your mail box and retrieve your 2026 Annual Notice of Change from Medicare. You were due to receive it no later than today per Center For Medicare Rules and Regulations. If will give you a good idea if you need to re-shop your Medicare Advantage or Part D Drug plan for the coming calendar year. If not, the following changes may.
10 changes to review before the Annual Election period, often referred to as the Open Enrollment (Oct 15–Dec 7)
If you’re on Medicare, 2026 brings important updates—especially to prescription drug coverage. The Part D out-of-pocket cap rises to $2,100, the standard deductible becomes $615, and Medicare’s first negotiated drug prices start on January 1, 2026. Medicare Advantage also gets new guardrails around prior authorization and appeals, and some supplemental “perks” are being narrowed. Check your Annual Notice of Change (ANOC) (it should arrive by Sept 30) and compare your plan options—small differences can mean big savings. If you’d like help, I’ll review your medications, doctors, and benefits to make sure you’re in the right fit for January 1.
Here is an itemized list of the 10 Key Changes:
Medicare changes your 2026 plan review should cover
1) Part D’s annual out-of-pocket cap rises to $2,100. Once a member’s 2026 Part D out-of-pocket spending reaches $2,100, they’ll pay $0 for covered Part D drugs for the rest of the calendar year.
2) The standard Part D deductible increases to $615. Plans can’t set a deductible higher than $615 in 2026 under the redesigned Part D rules.
3) Drug price negotiations start showing up at the counter. Medicare’s first set of negotiated Maximum Fair Prices (MFPs) for 10 widely used Part D drugs take effect January 1, 2026. Members should review their ANOC and plan formularies to determine how these prices impact their medications.
4) Insulin and adult vaccines: protections continue. Part D insulin remains capped and no-deductible; starting in 2026, the cap is the lesser of $35, 25% of the MFP, or 25% of the negotiated price. ACIP-recommended adult vaccines remain $0 under Part D.
5) “Pay-over-time” for prescriptions auto-renews. The Medicare Prescription Payment Plan (monthly billing instead of paying large amounts at the pharmacy) auto-renews in 2026 unless the member opts out. It smooths payments but doesn’t lower total costs—good to remind clients who tried it in 2025.
6) Medicare Advantage prior-auth and appeals guardrails tighten. For 2026, CMS says MA plans must honor previously approved inpatient admissions (can only reopen for obvious error or fraud), and CMS closes appeals loopholes so members and providers receive required notices and can appeal adverse coverage decisions. Expect fewer mid-stay reversals. Centers for Medicare & Medicaid Services
7) Limits on certain “extra perks” in MA (SSBCI) take effect. CMS codified non-allowable Special Supplemental Benefits for the Chronically Ill—examples include non-healthy food, alcohol, tobacco, and life insurance. Some plans may rebalance extras as a result.
8) Star Ratings update: new/returning measures. 2026 Stars add or reintroduce measures like Kidney Health Evaluation for Patients with Diabetes plus Improving/Maintaining Physical and Mental Health (weight = 1). Tougher cut points in 2026 may shift plan bonuses and benefit richness—worth watching locally.
9) Part D benefit design shifts behind the scenes. Liability shares change across phases (plans, manufacturers, CMS), and there’s a new subsidy for selected (negotiated) drugs. Members may see formulary/tier adjustments—another reason to compare plans.
10) ANOC timing: what to tell clients. Remind everyone: Annual Notice of Change (ANOC) letters arrive by September 30 each year; if they didn’t see one, call the plan. Open Enrollment runs Oct 15 – Dec 7 for Jan 1 effective dates.
Check your Annual Notice of Change (ANOC) (it should arrive by Sept 30) and compare your plan options—small differences can mean big savings. If you’d like help, I’ll review your medications, doctors, and benefits to make sure you’re in the right fit for January 1.
Other Developments
Some Medicare Advantage supplemental benefits (i.e. nutrition support, OTC medicine) may be reduced in favor of core services.
In six states, prior authorizations for certain Original Medicare services will be tested.
Part B and Part D premiums and deductibles are both set to increase—Part B premium up ~11.6%, and Part D premium by about 6%.
Who Am I?
In addition to being the editor of this blog I have has been helping individuals and families navigate the health and Medicare insurance landscape since 1986. With nearly four decades of experience, he specializes in Medicare Supplement, Medicare Advantage, and Medicare Part D prescription drug plans.
As an independent broker, I am appointed with virtually every competitive, A-rated Medicare insurance company in Texas, Indiana, Ohio, and Michigan. This broad access allows him to recommend the plan that truly best fits each client’s needs.
Above all, I work for my clients—not the insurance companies. You will never pay more by enrolling through me than you would if you purchased an insurance product directly from the carrier. My mission is to provide clear guidance, personalized recommendations, and ongoing support to ensure my clients get the coverage and peace of mind they deserve.
If you have any questions about 2026 Medicare Part D prescription drug plans, Medicare Advantage, or Medicare Supplement (Medi-Gap) policies, please give me a call.
Average premiums, benefits and plan choices for Medicare Advantage and the Medicare Part D prescription drug program should remain relatively stable next year, CMS said in a Sept. 26 news release. But MA enrollment is projected to decrease 900,000 in 2026.
Despite a slight dip in available MA plans nationally, over 99% of Medicare beneficiaries will still be able to access an MA plan.
The agency estimates the premiums for MA plans to drop from $16.40 to $14.00. On average, the total premium for standalone Part D is estimated to fall $3.81. CMS’ July forecast predicted elevated Medicare Part D base premium increases in the neighborhood of 6%.
Finding Your Doctor and Understanding Subsidies in HMO Plans
Shopping for individual or family health insurance can feel like navigating a maze—with dead ends, confusing signs, and few clear answers. Two of the most common pain points for shoppers are (1) trying to keep your current doctor while limited to an HMO network and (2) figuring out whether you qualify for a subsidy, known as an advance premium tax credit (APTC). Both challenges can make the process frustrating and overwhelming, especially during open enrollment when time is limited.
The HMO Headache: “Will My Doctor Be Covered?”
One of the biggest shocks people face when shopping for health insurance is realizing that their trusted doctor or medical provider might not be covered under a new plan—especially if it’s an HMO (Health Maintenance Organization). Unlike PPOs (Preferred Provider Organizations), which offer broader provider access and out-of-network options, HMO plans restrict coverage to a specific network of doctors and hospitals. If your doctor isn’t in the network, you may have to pay the full cost of your visit out of pocket—or switch doctors entirely.
Unfortunately, trying to find this information is often easier said than done.
Outdated or Inaccurate Provider Directories: Online directories can be incomplete or outdated. It’s not uncommon for a provider to be listed as “in-network” only for you to find out later they’ve left the plan.
Hard-to-Navigate Insurance Websites: Many insurance carrier sites don’t make it easy to search by doctor name, location, or specialty. Even worse, each plan may have its own “network tier,” adding another layer of complexity.
No Universal Search: There’s no centralized tool that lets you enter your doctor’s name and see every marketplace plan that includes them. You have to check each insurance company or plan individually.
For people with ongoing care needs—like managing chronic conditions or continuing with a trusted pediatrician or specialist—the possibility of switching providers isn’t just inconvenient, it can feel risky.
The Subsidy Puzzle: “Do I Qualify for Help Paying My Premium?”
The Affordable Care Act (ACA) made health insurance more accessible by offering subsidies for people who meet certain income guidelines. These subsidies, officially called advance premium tax credits, lower your monthly premium based on your household size and income.
The good news is that many people qualify.
The bad news is that determining whether you qualify can feel like filling out a tax return just to get a quote.
Income Guesswork: Subsidy eligibility is based on your estimated household income for the upcoming year. That’s right—you must predict your future income, even if you’re self-employed or work variable hours.
Family Dynamics Matter: Your household size includes dependents—even if they don’t need insurance—and income from every working member. This means getting it right often requires gathering data from multiple people.
Mid-Year Changes Complicate Things: If your income or family size changes mid-year, you may need to report it or risk having to repay part of your subsidy at tax time.
The ACA “Cliff” and “Glide Path”: Previously, you could lose your subsidy entirely if your income was even $1 over the limit. Recent changes have smoothed this out, but they are still complicated and frequently misunderstood.
And while tools like Healthcare.gov’s calculator are helpful, they often rely on broad estimates. They can’t account for all variables, such as gig work, investment income, or multiple part-time jobs.
Why It Feels So Frustrating
When you shop for health insurance, you’re not just picking a product—you’re making decisions that affect your finances, your family’s well-being, and your access to care. The stakes are high, yet the process often feels opaque and unnecessarily complicated.
You’re expected to:
Compare dozens of plans with unfamiliar terms,
Check if your providers are covered (without reliable tools),
Predict your income a year in advance,
And hope you don’t make a mistake that costs you money or coverage.
Tips for a Smoother Experience
While the system isn’t perfect, there are ways to reduce frustration:
Use a Licensed Agent or Broker: Agents specializing in ACA plans can often help you find plans that include your provider and determine if you qualify for subsidies—all at no extra cost.
Call Your Doctor’s Office: Don’t rely solely on insurance directories. Call your provider’s office directly to confirm if they accept a specific plan.
Keep Documentation: If your income fluctuates, keep clear records. This will help you provide accurate estimates and support your case in the event of an audit or dispute.
Update Changes Promptly: If your income or household size changes mid-year, report it on your health insurance marketplace to avoid surprise bills or tax penalties.
In Summary
Shopping for individual or family health insurance can be a stressful process—especially when you’re trying to keep your doctor and figure out if you qualify for financial help. Between restrictive HMO networks and confusing subsidy rules, it’s easy to feel stuck. But with a little extra diligence, some expert help, and the right questions, you can find a plan that fits your needs without sacrificing peace of mind.
If the process still feels overwhelming, you’re not alone. Many Americans share the same frustrations—and continue to hope for a more user-friendly system in the future.
Below is a chart outlining estimated income thresholds for qualifying for an Advance Premium Tax Credit (APTC) in 2025. These thresholds are based on a percentage of the Federal Poverty Level (FPL), which is adjusted annually. For simplicity, the chart includes 2024 FPL figures (used for 2025 coverage) and the income ranges (100%–400%+ of FPL) where most people qualify for subsidies under the ACA.
📝 Note: Due to the American Rescue Plan and Inflation Reduction Act, subsidies may extend beyond 400% of the FPL, with a sliding scale that caps the percentage of income spent on premiums. These extended subsidies are currently in place through 2025.
2024 Federal Poverty Level (FPL) and APTC Income Guidelines for 2025 Coverage
Household Size100% / FPL400% / FPLTypical APTC Eligibility Range
Minimum Income: You must earn at least 100% of the FPL to qualify for a subsidy in most states. In Medicaid expansion states, if you earn less than 138% FPL, you may qualify for Medicaid instead.
Upper Limit Removed: Thanks to temporary reforms, people earning above 400% FPL may still qualify for a subsidy if the cost of the benchmark plan exceeds ~8.5% of their income.
Household Size: Includes you, your spouse, and any dependents claimed on your tax return.
💡 What This Means for You
If your estimated annual income falls between the ranges shown above, you likely qualify for help paying your monthly health insurance premium.
Households earning more than 400% of the FPL may still qualify if their premiums exceed about 8.5% of income, thanks to current federal subsidy expansions.
Eligibility is based on your tax household — including you, your spouse, and dependents you claim on your tax return.
If your income is below 138% FPL, you may qualify for Medicaid (in most states).
DO NOT CALL AN 800 NUMBER and talk to some anonymous employee of an insurance company. Not only are they restricted to limiting you exclusively to their company’s options—but your personal information will be instantly sold and shared. Your phone is going to begin ringing off the hook!
I’ve been specializing in Medicare-related insurance for over thirty years, right here in The Woodlands, Texas, USA! I represent every Medicare-related product, including Supplement, Advantage, and Part D Drug plans, from virtually every “A” rated company doing Medicare-related business in Texas. And I CHARGE NO FEE for my services! Deal with a local agent/broker who values your business enough not to share it with anyone!
D. Kenton Henry Editor, Agent, Broker Office: 281.367.6565 Text my cell 24/7 @713.907.7984 Email: Allplanhealthinsurance.com@gmail.com
By D. Kenton Henry Editor, HealthandMedicareRelatedInsurance.com Agent, Broker 28 January 2025
Hello again, and welcome to 2025! Early last October, just prior to the Medicare Annual Election Period (AE), I informed you of the many changes coming to Medicare Part D Prescription Drug Plans in the coming calendar year in which we now find ourselves. I explained the pros and cons that many of you are now experiencing in real time. On the positive side, I am certain many are celebrating that their annual drug costs (for Part D covered drugs) can never go beyond the new annual maximum out-of-pocket (OOP) of $2,000! And, hopefully, you are not experiencing the negatives—such as learning your Rx drug (which was previously covered) is no longer or its price has increased dramatically! Once again, we realize the government can giveth or taketh away.
But there is one thing in which you have a certain amount of control, and this is the ideal time of year to exercise that control. During the AEP, insurance companies, agents, and brokers work overtime seven days a week to see that their clients, and prospective clients, are guided to the Medicare Advantage and Part D Drug plans that best meet their needs. To do this correctly, an agent must understand the client’s needs and objectives and then do, what is often, extensive research to ensure a person’s drugsare covered and they have access to their preferred providers. In some cases, this can take minutes and, in others, hours over repeated phone calls. In most cases, you won’t get the latter from a company employee on the end of an 800 number, but you will get it from me.
Now that the AEP ended December 7th, agents have much more time to assist you in improving the cost of your Medicare Supplement coverage. As you may know, Medicare Supplement is not subject to annual enrollment periods in Texas or most states. What this means, is you can re-shop your Supplement coverage to find identical (or improved) coverage 365 days per year. The incentive for doing so is that you may save 30% or more in premiums. Because Medicare Supplement premiums go up each year as we age, it doesn’t take too many years before most of us begin to wonder if our premium is still reasonable or competitive. The reality is, if your policy is three years or older, you will indeed safe significantly by switching to a policy with the same letter designation, e.g., Plan G. I have many clients whose policy premiums had increased to well over $300 per month that I was able to lower (with new coverage) to less than $200 per month!
Additional reasons to re-shop now are that a few “A” rated companies are particularly interested in expanding their block of business. This does not imply a compromise in the quality of their customer service or rate stability. It simply means that through prudent management and staff expansion, they can be more competitive, significantly lowering your premium. Additionally, you may now have a spouse, or in some cases, simply another adult living with you—making your new policy available for a “Household Discount”. Typically, these discounts can lower your premium 7-12%, and—if the other person is covered by the same company—that discount will apply to their existing policy also!
So what is the catch? The catch is that now that you have been in Medicare Part B 6 months or more, you must go through underwriting and be approved for the new coverage based on your current health and relatively recent health history. The bottom line is, if your current conditions are well controlled with medication, you do not suffer from any chronic condition that poses a long-term liability to the insurance company, and you have no pending surgeries or hospitalizations—you are a good candidate for replacement coverage. The worst scenario is you are declined. In this case, all you are out of is the small amount of time you took to complete the application.
THE FOLLOWING IS A SYNOPSIS OF THE PROS AND CONS OF RE-SHOPPING YOUR COVERAGE:
Re-shopping a Medicare Supplement (Medigap) policy can provide several advantages for recipients, especially if their needs or circumstances have changed since they first enrolled. Here are the key benefits:
1. Cost Savings
Premium Reduction: Medigap premiums can vary significantly between providers for the same coverage. Shopping around may uncover lower premiums for the same plan (e.g., Plan G or Plan N).
Health Status Discounts: If your health has improved since your initial enrollment, you might qualify for a lower premium rate with another insurer.
Household Discounts: Some insurers offer discounts if multiple members of the household enroll in their Medigap plans.
2. Better Coverage Options
Change in Needs: If your healthcare needs have increased or decreased, you might find a plan that better aligns with your current situation, such as switching from a high-deductible plan to one with lower out-of-pocket costs.
Additional Benefits: New Medigap plans might include perks like fitness programs, telehealth, or wellness benefits that weren’t available when you initially enrolled.
3. Access to New Insurers
Competitive Market: New insurers entering the market may offer attractive rates or better customer service than your current provider.
Provider Reputation: Switching to a more reputable insurer can improve your overall satisfaction and ensure reliable claims processing.
4. Avoiding Rate Increases
Age-Based Increases: Some policies increase rates as you age. Shopping around may allow you to switch to a community-rated policy where premiums are based on a group average rather than individual age.
Annual Adjustments: If your current insurer has raised premiums significantly, exploring alternatives can help you lock in a more stable rate.
5. Improved Customer Service
If your current insurer has poor customer service or limited support, switching to a provider with higher satisfaction ratings can enhance your overall experience.
6. Medicare Advantage Comparison
While re-shopping Medigap policies, some recipients may realize that a Medicare Advantage (Part C) plan is more cost-effective or suitable for their needs. These plans often include additional benefits like dental, vision, and hearing coverage.
7. Regulatory Benefits
Guaranteed Issue Rights: In some situations (e.g., losing coverage or moving), recipients have guaranteed issue rights, allowing them to switch Medigap plans without medical underwriting.
Trial Rights: If you tried a Medicare Advantage plan for less than 12 months and decide to switch back to Original Medicare, you may have a guaranteed right to re-enroll in a Medigap plan.
8. Customizing for Future Needs
Planning ahead for potential healthcare changes can ensure that you are prepared for costs that might arise later, such as skilled nursing care or extensive outpatient services.
Considerations When Re-Shopping
Medical Underwriting: Outside of guaranteed issue periods, you may need to answer health questions, which could affect your eligibility or rates.
Plan Standardization: All Medigap plans with the same letter (e.g., Plan G) offer identical core benefits, regardless of the insurer, making it easier to compare prices.
Timing: The best time to switch is typically during your open enrollment period or when you have guaranteed issue rights.
By re-shopping their Medigap policy, Medicare recipients can ensure they are getting the best value and coverage for their evolving needs.
I am an independent agent with more than three decades in the medical insurance industry. As I have aged, so have my clients, and Medicare-related insurance (Supplement, Advantage, Part D) has become my specialty. I represent virtually every “A” rated insurance company in Texas as well as three others. I provide objective advice based on empirical numbers inclusive of costs and satisfaction surveys.
Significantly, I do not charge a fee for my service. You are charged no more for acquiring a product through me than if you went in the front door of the insurance company whose product you elected and acquired it directly from them!
Please allow me to assist you in lowering the cost of your Medicare-related insurance. I look forward to working with you!
By D. Kenton Henry Editor, Broker, Agent 9 August 2024
For all Americans seeking to obtain or renew “Individual and Family” health insurance in 2025, there are (as always) certain changes to be anticipated.
Open Enrollment Period (OEP)—the period when all U.S. citizens may purchase health insurance for a January 1 effective date of the coming calendar year—runs from November 1st to December 15th. For those who, for whatever reason, want a February 1 effective date—the cutoff is January 15th. After that, a person must qualify for a Special Election Period (SEP). The most common of these is “loss of coverage through no fault of one’s own. During a SEP, an individual has 60 days to pick a plan. That plan will become effective on the first of the month after the date of the application.
To begin, let’s get the negatives out of the way.
THE NEGATIVE:
In 2025, ACA (Affordable Care Act) individual and family health insurance premiums are expected to increase by a median of 7%. This rise is driven by several key factors, including the increasing costs of hospital services, workforce shortages, and growing demand for high-cost specialty medications like GLP-1 drugs commonly used for weight loss and diabetes management (such as Ozempic). General inflation and healthcare provider consolidation are also contributing to these hikes.
Although most enrollees in ACA plans receive subsidies that will mitigate the impact of these increases, the cost burden on the federal government will grow as more funds will be needed to cover the subsidies. Insurers across the country are proposing premium increases that vary significantly, ranging from 5% to 10% on average, with some areas seeing rates fluctuate outside this range.
THE POSITIVE:
As we approach 2025, the Affordable Care Act (ACA) continues to evolve, aiming to address the shifting landscape of healthcare needs and to improve the accessibility and affordability of health insurance for individuals and families. The upcoming changes reflect ongoing efforts to enhance coverage, reduce costs, and ensure that more Americans have access to quality care. Here’s a comprehensive look at what you can expect from the ACA’s individual and family health insurance provisions in 2025.
1. Expanded Subsidies and Enhanced Affordability
One of the most significant changes coming in 2025 is the expansion of subsidies for health insurance premiums. Building on previous enhancements, such as those from the American Rescue Plan Act and the Inflation Reduction Act, the ACA will offer even more robust premium assistance. These expanded subsidies are designed to make health insurance more affordable for a broader range of income levels, particularly benefiting middle-income families who previously struggled with premium costs.
For 2025, the eligibility for premium tax credits will be extended, and the income thresholds for receiving assistance will be adjusted to account for inflation and rising living costs. This means that more individuals and families will qualify for financial help, reducing the burden of monthly premiums and making comprehensive coverage more accessible.
2. Increased Cost-Sharing Reductions
In addition to expanding premium subsidies, the ACA will also introduce enhanced cost-sharing reductions (CSRs). These reductions will lower out-of-pocket costs such as copayments, coinsurance, and deductibles for low- and moderate-income families. The aim is to make healthcare services more affordable at the point of care, not just in terms of monthly premiums.
The improved CSRs will be particularly beneficial for those who purchase coverage through the ACA marketplaces, ensuring that even the most essential health services, like prescription drugs and specialist visits, are within reach for more Americans.
3. Broader Coverage Options and Flexibility
The ACA will introduce more flexibility in plan design and coverage options starting in 2025. Health insurance plans available through the ACA marketplaces will offer a wider variety of coverage levels and network options, allowing individuals and families to choose plans that better match their specific needs and preferences.
For example, there will be more options for plans that cater to different health conditions or provide enhanced preventive care services. This diversification aims to address the diverse needs of the population and provide more tailored solutions to meet individual health requirements.
4. Enhanced Support for Mental Health and Substance Use Treatment
Recognizing the growing importance of mental health and substance use treatment, the ACA will place a stronger emphasis on coverage for these services in 2025. Insurance plans will be required to offer more comprehensive mental health benefits, including increased access to therapy, counseling, and substance use disorder treatment.
This change reflects a broader understanding of the integral role mental health plays in overall well-being and aims to reduce the barriers to accessing necessary mental health services.
5. Strengthened Protections Against Discrimination
The ACA will bolster protections against discrimination in health insurance. New regulations will ensure that insurers cannot deny coverage or charge higher premiums based on pre-existing conditions, gender, or other personal factors. Additionally, there will be greater oversight to ensure that insurance plans adhere to these non-discrimination policies.
These protections aim to create a more equitable healthcare system and to ensure that all individuals have fair access to health insurance, regardless of their personal circumstances.
6. Improvements to the Enrollment Process
The enrollment process for ACA health insurance plans will become more streamlined and user-friendly. In 2025, the federal and state-based marketplaces will introduce enhanced digital tools and support services to assist individuals and families with plan selection and enrollment. This includes improved online interfaces, more robust customer support, and clearer guidance throughout the enrollment period.
The goal is to reduce barriers to accessing coverage and to make it easier for people to navigate their options and secure the insurance that best fits their needs.
7. Emphasis on Preventive and Wellness Services
The ACA will continue to focus on preventive care and wellness services. In 2025, there will be increased incentives for health plans to cover preventive services without cost-sharing and to provide additional resources for wellness programs. This shift aims to encourage healthier lifestyles and early detection of potential health issues, ultimately reducing long-term healthcare costs and improving overall public health.
Conclusion:
The changes to the ACA’s individual and family health insurance provisions in 2025 represent a significant step forward in making healthcare more affordable, accessible, and equitable. With expanded subsidies, increased cost-sharing reductions, broader coverage options, and enhanced support for mental health, the ACA is set to offer even greater support to those in need. As these changes are implemented, individuals and families can expect a more supportive and responsive healthcare system that better meets their needs and helps them achieve better health outcomes.
*Please refer to Feature Articles 1 and 2 below the comments box for details on upcoming changes.
Whether you feel you qualify for an “Advanced Premium Tax Credit” (premium subsidy) or not, I can guide you through the process of determining such and enrolling in the plan of your choice for 2025. My years of experience specializing in medical insurance, including ever since ACA compliant plans became available on January 1, 2014, make the process go as quickly and smoothly as possible. Please contact me. There is no obligation to utilize my service and no charge for doing so. If you elect to acquire a policy I introduced you to, I only ask that you go through me to do so. You will be charged no more for the policy than if you walked through the front door of the insurance company and acquired it directly. I am currently appointed with every insurance company doing business in SE Texas; however, I represent you and your interests first and foremost.
THE KAISER FAMILY FOUNDATION (KFF) – The independent source for health policy research, polling, and news.
The independent source for health policy research, polling, and news.
Tammie Smith August 5th, 2024
Marketplace Insurers are Proposing a 7% Average Premium Hike for 2025 and Pointing to Rising Hospital Prices and GLP-1 Drugs as Key Drivers of Costs
ACA Marketplace insurers are proposing a median premium increase of 7% for 2025, similar to the 6% premium increase filed for 2024, according to a new KFF analysis of the preliminary rate filings. Insurers’ proposed rate changes – most of which fall between 2% and 10% – may change during the review process.
Although the vast majority of Marketplace enrollees receive subsidies and are not expected to face these added costs, premium increases generally result in higher federal spending on subsidies. The justifications insurers provide for these premium changes also shed light on what is driving health spending more broadly.
Insurers cite growing health care prices – particularly for hospital care – as a key driver of premium growth in 2025, as well as growing use of weight loss and other specialty drugs, according to KFF’s examination of publicly-available documents.
This year, increases in the prices insurers are paying for medical care tend to affect premiums more than growth in the utilization of care. Insurers say workforce shortages and hospital market consolidation, which can put upward pressure on health care costs and prices, are increasing 2025 health insurance premiums.
Meanwhile, growing demand for Ozempic, Wegovy, and other costly GLP-1 drugs, which are used to treat diabetes and obesity, is increasing prescription drug spending.
The full analysis and other data on health costs are available on the Peterson-KFF Health System Tracker, an online information hub dedicated to monitoring and assessing the performance of the U.S. health system.
One way insurers seek to control costs is to limit the size of the physician networks serving their plans. Providers agree to lower fees and other terms with insurers in order to be included in one or more of the networks they offer. Insurers then either limit coverage to services provided by network providers or encourage enrollees to use network providers through lower cost sharing. Reducing the number of providers in-network can effectively reduce plan costs, but it also limits enrollees’ choices, increases wait times, and can complicate the continuity of care for those switching plans. Enrollees receiving care from out-of-network providers often face coverage denials or substantially higher out-of-pocket expenses. These factors highlight how the size and composition of provider networks impact access to care and the financial protection insurance provides enrollees.
The breadth of provider networks in the Affordable Care Act (ACA) Marketplaces has been the subject of significant policy interest. Insurers often compete aggressively to be among the lowest-cost plans, potentially leaving enrollees with poor access. According to the 2023 KFF Survey of Consumer Experiences with Health Insurance, one in five (20%) consumers with Marketplace plans reported that in the past year, a provider they needed was not covered by their insurance, and nearly one in four (23%) said a provider they needed to see that was covered by their insurance did not have appointments available. Enrollees with Marketplace coverage were more likely than those with employer coverage to face these challenges. While the Centers for Medicare and Medicaid Services (CMS) establishes minimum standards for the adequacy of provider networks for Marketplace plans, insurers retain considerable flexibility in how they design networks and how many providers they include. As a result, the breadth of plan networks varies considerably within counties, presenting challenges for consumers who need to select a plan with little information on the network breadth of their options.
This brief examines the share of doctors participating in the provider networks of Qualified Health Plans (QHPs) offered in the individual market in the federal and state Marketplaces in 2021, and how network breadth affected costs for enrollees. The analysis uses data on the physician workforce, from 2021, matching that to provider networks in marketplace plans from the same year. Doctors filing Medicare Part B claims in or near each county are considered to be part of the active workforce available to Marketplace enrollees. Only doctors filing a claim and therefore known to have engaged in patient care in 2021 were included. The share of local physicians participating in a network is a rough measure of how much access enrollees have; depending on the number of providers in the area and the workloads of those physicians, enrollees in plans with similar breadths may face different wait times to book appointments. The share of local physicians participating in-network distinguishes whether enrollees have a broad or narrow choice of local doctors. Those in plans including a small share of doctors have fewer options when trying to find a provider with available appointments. See the Methods section for more details.
Key Findings
On average, Marketplace enrollees had access to 40% of the doctors near their home through their plan’s network, with considerable variation around the average. Twenty-three percent of Marketplace enrollees were in a plan with a network that included a quarter or fewer of the doctors in their area, while only 4% were in a plan that included more than three-quarters of the area doctors in their network.
Some of the narrowest network plans were found in large metro counties, where enrollees on average had access to 34% of doctors through their plan networks. Marketplace enrollees in Cook County, IL (Chicago) and Lee County, FL (Fort Myers) were enrolled in some of the narrowest networks (with average physician participation rates of 14% and 23%, respectively). Plans in rural counties tended to include a larger share of the doctors in the area, though rural counties had fewer doctors overall relative to the population compared to large metro counties.
On average, more than one-quarter (27%) of actively practicing physicians were not included in any Marketplace plan network.
On average, Silver plans with higher shares of participating doctors had higher total premiums. Compared to plans where 25% or fewer of doctors participated in-network, those with participation rates between 25% and 50% cost 3% more while those with participation rates of more than 50% cost 8% more. (Silver plans are midlevel plans in terms of patient cost-sharing and are particularly significant because they are the benchmark for federal premium subsidies.)
More than 4 million enrollees (37% of all enrollees) lived in a county in which the two lowest-cost Silver plans included fewer than half of the doctors in the area and a broader plan was available. In order for these enrollees to enroll in the cheapest Silver plan that included at least half the doctors, they would have needed to spend an additional $88 per month.
How Broad are Marketplace Plan Physician Networks?
On average, enrollees in the ACA Marketplaces had access to 40% of the doctors near their homes through their plan’s network. This share was similar for pediatric and non-pediatric doctors.
A quarter of enrollees were in plans where fewer than 26% of the local doctors participated in their plan’s network, while another quarter were in plans where at least 54% of local doctors participated.
There is no formal definition of what constitutes a narrow network plan. Some researchers have labeled plans covering fewer than a quarter of the physicians in an area as narrow. Under this definition, 23% of Marketplace enrollees were in a narrow network plan. About seven in ten enrollees (70%) were in a plan that included half or fewer of the doctors near their home. Only 4% of enrollees were in a plan that included at least three-quarters of local doctors, and 1% of enrollees were in a plan that included at least 85% of local doctors.
How Broad Are Plan Networks for Primary Care and Physician Specialties?
Even a plan with a relatively large share of local doctors participating in its network may not have enough doctors in different specialties to meet the needs of plan enrollees. In particular, enrollees with chronic conditions may look for plans that include their doctors across multiple specialties.
Primary Care Physicians: Marketplace enrollees, on average, had plan networks that included 43% of the primary care doctors in their area. A quarter of Marketplace enrollees had plan networks that included fewer than 25% of primary care doctors. More than half a million Marketplace enrollees were in a plan with fewer than 50 in-network primary care doctors near their homes. As is the case for physician networks overall, primary care physician networks tended to be narrower in large metro counties, where the average enrollee had a plan network that included 35% of local primary care doctors. While primary care doctors account for a smaller share of spending than specialists, they play an important role in insurers’ network design either by acting as gatekeepers to specialty care and referring patients to specialists.
Specialists: Marketplace plan networks tended to include a larger share of practicing medical and surgical specialists than primary care physicians. The average Marketplace enrollee had a plan network that included 52% of medical specialists and 53% of surgical specialists in their area; however, one-quarter of Marketplace enrollees had access to fewer than 34% of the medical specialists and 32% of the surgical specialists. On average, Marketplace enrollees had plan networks that included 21% of hospital-based physicians, which may include anesthesiologists, radiologists, pathologists, and emergency physicians.1 Information on additional specialties is available in the appendix.
Psychiatrists: Marketplace networks for psychiatrists were smaller. On average, Marketplace enrollees had access to 37% of the psychiatrists in their area through their plan.2 Twenty-five percent of Marketplace enrollees were in a plan that included 16% or fewer of the psychiatrists near their homes.
How Does Network Breadth Vary by Location?
Network breadth varied based on where plans were offered, with those in urban areas having lower physician participation rates, on average. In 2021, CMS designated county types based on their population and density; there are 78 Large Metro counties and 723 Metro counties. Most Marketplace enrollees lived in one of these urban county designations, including 38% in Large Metro counties and 48% in Metro counties.
Urban Counties: While Large Metro and Metro counties had more doctors, smaller shares of them participated in Marketplace plan networks compared to doctors in more rural areas. Marketplace enrollees in Large Metro counties, on average, had access to 34% of the doctors in their area through their plan networks, with a quarter enrolled in a plan whose network included fewer than 23% of local doctors. Marketplace enrollees in Metro counties, on average, had access to 42% of local doctors through their plan networks, while those in Rural counties, on average, had access to 52% of local doctors.
The 30 counties with the highest enrollment in the Marketplaces collectively represented 34% of all Marketplace enrollees and 21% of the U.S. population. These counties are typically urban and disproportionately in states that have not expanded Medicaid under the ACA.3
There was significant variation in network breadth across these 30 counties. Differences in average network breadth across these counties are the result of a combination of factors including the physician workforce, market characteristics, and insurer strategies. With networks with low provider participation rates, most Marketplace enrollees in Cook County, IL (Chicago) had access to fewer than one in six (14%) doctors in their area on average. Similarly, Marketplace enrollees in Lee County, FL (Fort Myers) and Fort Bend County, TX (outside Houston) had in-network access to less than a quarter of local doctors (23% and 24%, respectively). In contrast, some larger US cities had broader networks than those available in Houston and Chicago. For example, enrollees in Middlesex County, MA (outside Boston), Gwinette County, GA (outside Atlanta), and Travis County, TX (Austin) had in-network access to almost half of the doctors in their areas on average (46%, 46%, and 49%, respectively).
In 2021, 14% of Marketplace enrollees (1.6 million people) lived in four counties: Los Angeles, CA; Miami-Dade, FL; Broward, FL (Fort Lauderdale); and Harris, TX (Houston). On average, enrollees in each of these counties had in-network access to less than 4-in-10 local doctors (25%, 36%, 38%, and 25%, respectively).
High physician participation rates may not result in meaningful choice if there are few doctors in the area in the first place. For example, enrollees in Hidalgo County, TX (McAllen), on average, had access to 61% of local doctors through their plan networks, but this may have reflected chronic shortages in the number of practicing doctors in the county.4
Rural Areas: On average, Marketplace enrollees in Rural counties had access to about half (52%) of local doctors through their plan networks, higher than the average in more urban counties. The higher provider participation rates in rural areas, however, need to be considered in the context of the small number of primary care doctors and specialists practicing in these areas. For example, 2.9 million Marketplace enrollees in Rural counties had fewer than 10 dermatologists in their local area, 2.5 million had fewer than 10 gynecologists, and 1.7 million had fewer than 10 cardiologists in their plan networks. In some cases, these providers may already have full panels, and an enrollee’s choice may be even more limited than the number of physicians who accept the plan.
County Demographics: On average, Marketplace enrollees living in counties with a higher share of people of color had narrower networks than counties with a smaller share.5 The quarter of Marketplace enrollees living in the counties with the highest share of people of color had access to 34% of doctors in-network, on average, compared to 42% in counties with a smaller share of people of color. This difference may reflect the higher concentration of people of color in large metro counties, where plans typically had narrower networks.
How Much Choice Do Consumers Have Over Networks in the County Where They Live?
Provider networks vary within counties, meaning that individuals shopping for a Marketplace plan may have the option to enroll in plans with vastly different network breadths. In 2021, 70% of enrollees (nearly 8 million people) lived in a county where one or more plans covered fewer than a quarter of the doctors in the area. Among these enrollees, nearly 4.3 million (54%) also had the opportunity to enroll in a plan that included more than half the doctors in the area.
In the 30 counties with the most enrollment, enrollees could choose from about 8 distinct plan networks, on average. Even within the same county, enrollees may have access to vastly different shares of physicians in-network. For example, in Lee County, FL (Fort Myers), a quarter of Marketplace enrollees were enrolled in plans with networks that included fewer than 5% of local doctors, while a quarter were enrolled in plans with networks that included more than 45%. Similarly, in Travis County, TX (Austin), a quarter of Marketplace enrollees were enrolled in a plan with a network that included fewer than 36% of local doctors, while a quarter were enrolled in plans that included at least 70%. Consumers in these counties have the opportunity to enroll in plans with vastly different physician networks but often face higher premiums to do so. (See section “How is Network Breadth Related to Plan Premiums?” for details.)
Access to a “Broad” Network Plan: A large share of Marketplace enrollees (91%) lived in a county in 2021 where they could not choose a plan with a network that included at least 75% of doctors in their areas. Among the 30 counties with the most Marketplace enrollment, only two—Middlesex County, MA (outside Boston) and Hidalgo County, TX (McAllen)—had at least one plan network choice with a physician participation rate of 75% or more. In most cases, the broadest Marketplace plan network offered in these 30 counties was much narrower than this. For example, the physician participation rate for the broadest Marketplace plan network offered was 22% in Cook County, IL (Chicago), 38% in Hillsborough County, FL (Tampa), and 40% in Maricopa County, AZ (Phoenix). In these counties, shoppers were unable to enroll in a plan that covered at least half of the doctors in their community, even if they were willing and able to pay more.
Doctors Not Participating in Any Marketplace Network: Some doctors did not participate in any Marketplace plan network in 2021. On average, 27% of actively practicing physicians who submitted Medicare claims were not included in any Marketplace plan network offered to enrollees that year. This means that people transitioning to a Marketplace plan from another coverage source may not have been able to find any plan that included their doctor. In some counties, a much higher share of doctors did not participate in any Marketplace network, including Cook County, IL (Chicago), where 60% of doctors did not participate in any Marketplace plan networks, Dallas County, TX (36%), and Lee County, FL (Fort Myers) (41%).
How Visible Are Differences in Network Breadth to Plan Shoppers?
The difficulty of selecting an appropriate plan for a consumer’s health needs is heightened by the tremendous number of choices in many counties. The average Marketplace consumer had a choice of more than 58 plans (including 23 Silver plans) in 2021, a number that has since grown.6
Plan choices can involve different provider networks. For example, in Harris County, TX (Houston), consumers in 2021 had a choice of 87 plans that used seven different provider networks, with physician participation rates that ranged from 9% to 52%. However, these network differences are largely invisible to consumers. The lack of consumer tools to evaluate and measure plan networks can make it more challenging to choose a plan. Other than in a limited pilot operating in two states (Tennessee and Texas), the only tool available for HealthCare.gov consumers to evaluate a plan’s network is to search for individual providers, one by one, in directories, which may not always be up to date.
Further complicating the challenges of selecting plans, the marketing names of plans offered by the same insurer using different provider networks do not clearly indicate network differences. For example, AmeriHealth of New Jersey offers multiple Silver plans in Camden County, NJ. The narrow plan was marketed as “IHC Silver EPO AmeriHealth Advantage” (with a physician participation rate of 40%), while the broader network Silver plan was marketed as “IHC Silver EPO Regional Preferred” (with a physician participation rate of 74%). Based on these names, shoppers may not be able to discern that these plans had different networks with very different participation rates.
Shoppers can also search by plan type. The vast majority of Marketplace enrollees (84%) were in HMO or EPO plans in 2021, which have closed networks that generally do not cover non-emergency services provided outside of their provider network. A smaller share of Marketplace enrollees were in PPO plans (13%) and POS plans (4%), which provide some coverage for out-of-network care. The cost for such care can be quite expensive because out-of-network providers can sometimes balance bill and cost sharing for their services is typically higher and not subject to the annual out-of-pocket maximum.
Marketplace consumers seeking access to a broader choice of physicians and who have the choice of a PPO plan might assume such plan networks are analogous to the broad PPO networks offered to many in the employer market. On average in 2021, Marketplace enrollees who signed up for PPO plans had access to 53% of local doctors through their plan networks, compared to 37% for those enrolled in HMOs and 38% for those enrolled in EPO plans. However, plan type is not necessarily reflective of network breadth. In almost half (46%) of counties with both a PPO and either an HMO or EPO Marketplace plan, at least one HMO or EPO plan had a broader network than a PPO plan. Many Marketplace enrollees also did not have the option to choose a PPO plan: 60% of enrollees lived in a county in which only closed-network (HMO and/or EPO) plans were available.
Marketplace plans are categorized into metal levels based on the overall level of cost sharing required by the plans (deductibles, copays, etc.). In 2021, enrollees in Bronze, Silver, and Gold plans had access to similar shares of physicians in their areas (41%, 39%, and 44%, respectively). This is the result of issuers utilizing the same networks across metal levels within a county. In only 1% of counties did an insurer’s broadest Silver plan use a different network than its broadest Bronze plan.
HealthCare.gov has not yet widely released a consumer assistance tool to aid shoppers in filtering options by network breadth. Since 2017, CMS has operated a limited pilot with information on network breadth for consumers in Tennessee and Texas.7 Under this network transparency pilot, CMS provides measures of plan network breadth for hospitals, primary care providers, and pediatricians as an aid to Marketplace shoppers in those states. CMS calculates a participation rate by determining the share of providers participating in any Marketplace networks in the area. CMS then categorizes plan networks as “Basic” (0%-29%), “Standard” (30%-69%), or “Broad” (70%+), based on how many physicians participate in at least one QHP network. Whereas the denominator used throughout this analysis is physicians who submitted claims to Medicare, the CMS tool only considers providers that participate in Marketplace plans. Therefore, even plans with narrow networks in areas where most doctors do not participate in Marketplace plans could be labeled “standard” or “broad” using this method. For example, whereas 90% of physicians in Travis County, TX (Austin) who take Medicare participated in at least one Marketplace plan in 2021, only 64% of doctors in Dallas County, TX did. Therefore, a plan covering a quarter of all the available doctors in both counties would be considered a “basic” plan in Travis County, TX but a “standard” plan in Dallas County.
Generally, the method used in the CMS “network transparency” tool does not seem to facilitate comparing plan networks across counties and may exaggerate the breadth of plan networks, potentially leading some consumers to believe that their plan includes a larger share of local providers than it actually does. Under the CMS pilot method, only 16% of Marketplace enrollees in 2021 were enrolled in a plan that would be considered “basic”; this compares to 33% of Marketplace enrollees would be considered to be in a basic plan if the definition of local doctors used in this paper were applied.
Network Breadth by Plan Insurer
Marketplace shoppers may consider who the insurer is when making inferences about plan networks.
Blue Cross and/or Blue Shield (BCBS) plans are sponsored by a mixture of for-profit and tax-exempt insurers. While these companies are run independently, they are affiliated through an association, and many share a common heritage. In many states, the BCBS affiliates are the largest insurers participating in the Marketplace and may in some cases also be the largest insurers or administrators for employer-sponsored coverage as well. On average, enrollees in BCBS Marketplace plans in 2021 had access to 49% of doctors in their areas through their plan networks, a larger share than enrollees in plans offered by other insurers (35%).8 Even so, BCBS Marketplace plan networks, on average, excluded about half of the doctors available to those in traditional Medicare. Further, there was considerable variation in participation rates by doctors among plans sponsored by BCBS insurers, sometimes even within the same county. For example, in Wayne County, MI (Detroit), the Blue Care Network and Blue Cross/BlueShield plan network participation rates ranged from 20% to 59% across plan options. Similarly, in Camden County, NJ, Independence Blue Cross offered two networks, with physician participation rates of 40% and 74%. Florida Blue in Miami-Dade County, FL offered multiple plan networks with participation rates ranging from 25% to 51%.
Insurers Also Participating in Medicaid Managed Care: Insurers with a large presence in the Medicaid managed care organization (MCO) market also have a solid footprint in the Marketplaces. Overall, the breadth of Marketplace plan networks sponsored by MCO insurers was similar to that of insurers overall (41% vs. 40%, respectively).9 One of the largest MCOs that expanded into the Marketplaces is Centene Corporation, which sponsors plans under Ambetter, Health Net, and other brand names. The average participation rate for doctors in plan networks offered by Centene was lower than the overall Marketplace average (33% vs. 40%). Molina, another major MCO insurer offering Marketplace plans, had an average physician participation rate of 35% in its plan networks.
Integrated Delivery Systems: Integrated delivery systems, such as Kaiser Permanente, Geisinger Health Plan, and the Chinese Community Health Plan, institute a different approach to network design. Under these plans, health care financing and delivery are conducted by the same organization. Providers are typically employees of the plan or an affiliated medical group, and these plans generally do not cover non-emergency care provided by doctors outside of the network. Although enrollees in these plans may not have a wide choice of physicians in the area, these integrated models strive to improve access through care coordination and may be less complex for patients to navigate which providers are in and out of their networks. Enrollees in Kaiser plans, by far the largest integrated delivery system, on average, had access to about one in five (19%) doctors in their area. Of note, the breadth of Kaiser physician networks does not lower the overall Marketplace average substantially because only 7% of Marketplace enrollees nationally were enrolled in Kaiser plans.
Non-profit Insurers: On average, Marketplace enrollees covered by plans sponsored by non-profit insurers in 2021 had in-network access to 43% of the doctors in their areas, compared to 38% for those covered by for-profit insurers. Excluding enrollees in Kaiser health plans, enrollees covered by non-profit insurers had access to 47% of local doctors on an in-network basis on average.
How is Network Breadth Related to Plan Premiums?
On average, Silver plans with higher shares of participating doctors had higher total premiums. When compared to plans where fewer than 25% of doctors participated in-network, those with participation rates between 25% and 50% cost 3% more while those with participation rates of more than 50% cost 8% more. While other factors also contribute to plan premiums, including the breadth of hospital networks and the plan design, narrow physician networks were associated with meaningfully lower total costs. The average total premium for a 40-year-old enrolled in a Silver Marketplace plan in 2021 was $466 a month. For these enrollees to sign up for a Silver plan that included more than 50% of area physicians, their premiums would have increased $37 per month. The statistical model used to estimate these premium differences is described in the methods.
Enrollee Cost to Purchase a Broader Plan
Consumers with private health insurance generally consider the breadth of provider networks very important when choosing a plan, yet many remain price-sensitive when selecting plans with higher costs. A 2019 KFF/LA Times survey found that 36% of adults with employer coverage said the cost of the plan (premiums and cost sharing) was the main reason they chose their plan, while 20% cited the choice of providers.
One way to illustrate how the cost of broader plans is passed on to consumers is to consider the counties where enrollees face higher premiums for a broader plan. Most (90%) of Marketplace enrollees receive a tax credit to offset all or part of the cost of the monthly premium. The size of the premium tax credit available to enrollees is based on both household income and the cost of the benchmark plan, defined as the second-lowest-cost Silver plan. ACA enrollees are responsible for paying the entire amount between the cost of the benchmark plan and a higher-cost plan. Enrollees in counties where the benchmark plans have relatively low physician participation rates may need to pay a significant amount to enroll in a broad network plan.
Among Marketplace enrollees, 74% percent, or 8.5 million enrollees, were in a county where the two lowest-cost Silver plans had fewer than 50% of physicians participating in their networks. Of these, about half, or 4.3 million enrollees, did not have a Silver plan available to them that included at least half of the local physicians in its network; 4.2 million enrollees did have at least one such plan available to them. For those 4.2 million people, the average additional cost to enroll in a Silver plan with at least half the local doctors participating was $88 (for a 40-year-old).
One in five Marketplace enrollees (19%, or 2 million enrollees) lived in a county where the two lowest-cost Silver plans included fewer than 25% of local physicians in-network. Fifty percent of these enrollees, or 1 million enrollees, lived in a county where at least one plan included at least half the doctors. Among these enrollees, the cost to enroll in a plan with at least half the local doctors would have cost $95 more than the benchmark plan each month.
Implications for Consumers and Potential Federal Efforts to Increase Access to Care
Having a plan with a narrow network increases the chances that an enrollee receives care out-of-network, either inadvertently (e.g., receiving care from an out-of-network provider they did not choose at an in-network facility), or because they are unable to find an in-network physician at the time and place they need. It can also have consequences for enrollees’ ability to seek care in a timely fashion and their health. The 2023 KFF Survey of Consumer Experiences with Health Insurance found that 20% of adults with Marketplace coverage said that in the past year, a particular doctor or hospital they needed was not covered by their insurance. Among Marketplace enrollees who experienced this problem, 34% said that needed care was delayed, 34% said they were unable to get needed care, and 25% experienced a decline in health status.
Additionally, going out-of-network can be costly for enrollees. Enrollees using out-of-network providers may face higher cost sharing and balance billing if the services provided are not regulated by the No Surprises Act. Among those who indicated experiencing a network adequacy problem in the consumer survey, almost half (47%) said they ended up paying more out of pocket for care than expected, including 22% who said the additional cost was $500 or more.
Some have suggested that the design of the Marketplace encourages insurers to offer narrower networks compared to those included in employer plans in order to keep premiums down. Employers use health benefits to attract and retain workers and have an incentive to create broader networks that appeal to their workforce. One analysis found that primary care networks for large group plans were 25% larger than those found on the Marketplaces.10 The higher prevalence of narrow network plans corresponds to a greater share of enrollees facing challenges finding in-network providers. The 2023 KFF Survey of Consumer Experiences with Health Insurance found that adults with Marketplace coverage were more likely than those with employer-sponsored health insurance to report that a particular doctor or hospital they needed was not covered by their insurance (20% vs. 13%) (Figure 14). Additionally, 34% of Marketplace enrollees in fair or poor health reported that a particular doctor or hospital they needed was not covered by their plan, nearly two times more than those with an employer plan (16%). Similarly, a forthcoming KFF analysis of the 2022 National Health Interview Survey found that challenges finding doctors led some adults to delay or skip care (Appendix Figure 7). Those with non-group coverage, such as Marketplace plans, were twice as likely as those with employer plans to indicate that they had delayed or skipped care in the past year because they couldn’t find a doctor who accepted their plan (7% vs. 3%). Among those who visited a hospital or emergency room during the past year, 11% of non-group enrollees reported skipping or delaying care, compared to 5% of those with employer coverage.
Even still, network breadth is only one component of access to care and may not always gauge how well enrollees are served. There are many aspects consumers consider when selecting a plan. This analysis examines network breadth but does not address other standards that health plans, physician networks, and physicians are required to meet. Enrollees in plans with broad networks may still face challenges scheduling appointments and considerable wait times. For some specialties, such as psychiatry, workforce shortages make it hard for enrollees to find providers even in plans that include a broad swath of physicians. Workforce shortages in many rural areas mean that even if a plan has a broad provider network, there still may be an insufficient number of providers to meet the needs of that community. Furthermore, many enrollees face additional challenges using their plan, including stringent prior authorization requirements.
Similarly, a plan with a narrow network—measured as the share of physicians in the area participating—may still provide adequate access to care, just not necessarily with a broad choice of providers. States use a range of network adequacy rules, with many requiring the inclusion of different types of providers, but only ten evaluate wait times to determine if a network meets minimum standards. The ACA requires that Marketplace plans maintain networks sufficient in number and types of providers for the purpose of ensuring that all services will be accessible without unreasonable delay. Currently, federal network adequacy standards require that plans provide access to at least one in-network provider for 90% of plan enrollees living within certain time/distance thresholds (for example, in large metro areas, no more than 10 minutes or 5 miles from a primary care provider, or no more than 30 minutes or 10 miles from an oncologist.) Although these standards measure geographic proximity to in-network care, they do not measure network breadth. Additionally, starting in 2025, federal Marketplace plans will be required to meet maximum appointment wait-time standards (e.g., no more than a 15-calendar day wait for routine primary care appointments or 30 days for non-urgent specialty care appointments).
A central challenge in analyzing network breadth is the quality of available data. The inclusion of so-called “phantom providers”—physicians listed in the network but who are not actually available to plan enrollees at the location or in the specialty they are listed—may increase the apparent breadth of plan networks without actually increasing access to care. Federal laws and regulations require Marketplace plans to publish online an up-to-date and complete provider directory. However, CMS has found high rates of incomplete and inaccurate information in these directories. Additionally, the No Surprises Act Improvements in plan directory data would facilitate regulation and decrease the burden on consumers comparing and using the plan. In 2022, CMS solicited public comment on establishing a national provider directory that private plans could use as a database for their own plan directories. Further action on this proposal is still pending, but this could improve available information about the landscape of available providers, allowing for the development of improved consumer information about provider ratios that show the share of practicing area providers (overall and by specialty) included in the provider network of each QHP.
Ever since the passage of the Patient Protection and Affordable Care Act (ACA), commonly referred to as “Obamacare”, in 2010, the Department of Health and Human Services has dictated when and under what circumstances an individual and family can apply for and obtain health insurance. This period is known as the Open Enrollment Period, and it is upon us. Each year, between November 1st and December 15th, U.S. citizens and their families may apply for and obtain health insurance effective January 1st of the coming calendar year. From then until January 15th, they may apply for coverage effective February 1st. Beyond that date, they are locked out of any health insurance plan they were not enrolled in when the year ended. Only special circumstances such as losing “creditable” coverage through no fault of their own, moving out of a plan’s area, birth of a child, or death of a covered family member allow them to apply for coverage beyond the Open Enrollment Period. And only if they were insured when the special circumstance occurred and no more than 60 days have passed. Creditable coverage meets all the mandates of the Affordable Care Act, such as guaranteed coverage for pre-existing health conditions, including pregnancy and mental health disorders, along with no out-of-pocket for preventative medicine. All coverage is guaranteed so long as the above requirements are met.
If affordability of health insurance is an issue, Premium Tax Credits (subsidies) are available from the Department of Health and Human Services (DHS) to people or families whose income falls below a certain threshold.
WHO IS ELIGIBLE FOR THE PREMIUM TAX CREDIT?
To receive the premium tax credit for coverage starting in 2024, a Marketplace enrollee must meet the following criteria:
· Have a household income at least equal to the Federal Poverty Level (FPL), which for the 2024 benefit year will be determined based on 2023 poverty guidelines
· Can not have access to affordable coverage through an employer (including a family member’s employer)
· Can not be eligible for coverage through Medicare, Medicaid, the Children’s Health Insurance Program (CHIP)
· Have U.S. citizenship or proof of legal residency (Lawfully present immigrants whose household income is below 100 percent FPL can also be eligible for tax subsidies through the Marketplace if they meet all other eligibility requirements)
· If married, must file taxes jointly
Income: For the purposes of the premium tax credit, household income is defined as the Modified Adjusted Gross Income (MAGI) of the taxpayer, spouse, and dependents. The MAGI calculation includes income sources such as wages, salary, foreign income, interest, dividends, and Social Security.
Your tax credit is based on the household income estimate you put on your Marketplace application.
Income between 100% and 400% FPL: If your income is in this range (in all states) you qualify for premium tax credits that lower your monthly premium for a Marketplace health insurance plan. The lower your income is as a percent of the FPL—the higher your subsidy.
The easiest way to determine whether and for how much you qualify is to call me. You will estimate your 2024 household’s adjusted gross income and my subsidy calculator will tell us (based on the number of people in your household) how much your subsidy will be. If we give the DHS the same information you give me, my calculations are usually accurate to within $3.00 of what you will actually receive. We then apply that subsidy against the premium of the plan you wish to acquire and arrive at your net premium.
The number of people who qualify for subsidies continues to grow. For details on this, please refer to this chart and my feature article 2 below.
As to how much retail (gross) premiums are expected to grow from 2023 to 2024, estimates put the national average at 6%. (For the details on this, please refer to Feature Article 1 below.) Given the rate of core and real inflation, this should not come as a surprise. Acquisition of a subsidy will certainly offset ever-increasing premiums.
As always, the greatest challenge to the consumer and their agent/broker is affordability or obtaining the desired benefits. Instead, it is finding their doctors in the networks of a health plan. In 2024, as it was this year, there will be over 100 different plans available from six to eight different companies, depending on where one resides. Dealing with this myriad of options is where my three decades specializing in health insurance in the Houston area is invaluable. I know which hospitals are in which plan networks, and my provider search tools scan all plans without you having to go from company to company for results. Because I represent every company doing business in Texas, you can acquire information on all of them with one call to me.
Again, Open Enrollment begins November 1st, and for coverage during the entirety of 2024, it ends December 15th. Unlike going to the marketplace (Healthcare.gov) you will get me each time you call my local office with questions and for assistance and service–as opposed to an 800 number where you will get a different individual each time you call. My service is much more personalized and detailed than that of an hourly worker at the end of that toll-free number. If I don’t provide you with the level of service you deserve, I don’t have a client. And if I don’t have a client, I don’t earn a living. And it costs you no more to go through me than directly to the company whose policy you ultimately acquire.
I look forward to working with you and providing the best of service. Please call me.
D. Kenton Henry
Office: 281-367-6565 Text me 24/7 @ 713-907-7984 Email: Allplanhealthinsurance.com@gmail.com
This analysis of insurers’ preliminary rate filings shows that ACA Marketplace insurers are requesting a median premium increase of 6% for 2024. Insurers cite price increases for medical care and prescription drugs as a key driver of premium growth in 2024, In addition to inflation’s impact on medical costs, insurers point to growth in the utilization of health care, which fell in 2020 but has since returned to more normal levels.
Insurers’ proposed rate changes – most of which fall between 2% and 10% – may change during the review process. Although most Marketplace enrollees receive subsidies and are not expected to face these added costs, premium increases could result in higher federal spending on subsidies.
The analysis can be found on the Peterson-KFF Health System Tracker, an information hub dedicated to monitoring and assessing the performance of the U.S. health system.
Enhanced Marketplace subsidies have continued to drive up enrollment in the individual market, and the loss of Medicaid coverage by millions of people could contribute to this trend, according to a new KFF analysis. Meanwhile, enrollment in non-ACA-compliant plans is at a record low.
As of early 2023, an estimated 18.2 million people have individual market coverage, the highest since 2016. Individual market enrollment grew by about 29% between early 2020 and early 2023 — a result of enhanced subsidies introduced by the Inflation Reduction Act, increased outreach, and an extended enrollment period.
This enrollment growth could continue in 2023 as states resume Medicaid disenrollments amid the unwinding of the continuous enrollment provision. Some of the people losing Medicaid coverage may be eligible for subsidies on the ACA Marketplaces.
Due in part to the enhanced subsidies, about 4 in 5 individual market enrollees have subsidized coverage — the highest share since the ACA was implemented.
The number of people in non-compliant plans has fallen each year and could decrease further due to the Biden Administration’s proposed rule that would reverse the expansion of short-term plans. An estimated 1.2 million people were in non-ACA-compliant plans in mid-2022, compared to 5.7 million in mid-2015. These short-term plans often do not include certain benefits or coverage for pre-existing conditions and can impose a dollar limit on insurance coverage.
If unsubsidized premiums rise in 2024 due to higher health care prices and utilization, enhanced subsidies could shield most individual market enrollees from increases in their monthly payments.
By D. Kenton Henry editor, agent, broker 12 October 2022
In a year in which the annual inflation rate is over 9%, and the core inflation rate over 6%, there is some good news relative to Medicare Part D 2023 Drugs and Plan costs. And it comes just in time as the approximately 64 million Americans on Medicare will be electing their drug coverage during the “Annual Election Period” from October 15th through December 7th, for coverage to begin January 1.
While Medicare Part A (hospital and skilled nursing facility) coverage has been paid for during the working careers of most Americans or their spouses, Part B (out-patient coverage) has not. Medicare accesses an income-adjusted monthly premium based on a “two-year look-back at one’s income tax return. (for details refer to Chart 1, and Feature Article 1, below)
The base premium for individuals earning $97,000 or less, and couples filing jointly earning $194,00 or less, will be down $5.20 per month from $170.10 to $164.90.The Medicare Part B out-patient deductible will be down $7.00 from $233.00 to $226.00 in 2023. Although these decreases are nominal, to say the least, they are a move in the right direction.
The “not as good news” is that Part A Inpatient hospital costs to the beneficiary will be increasing. The inpatient hospital deductible is going to $1,600 for each admission – due to a different medical condition – or the same medical condition separated by 60 days or more.And the daily coinsurance for days 61-90 is going to $400 and for lifetime reserve days to $800. It is easy to see that most can ill afford to be liable for the cost of an extended hospital stay without supplemental coverage, such as Medicare Supplement or Medicare Advantage, to pay these expenses. (for details, refer to Chart 2 below)
Relative to Medicare Part D Prescription Drug Plans, the headline subject of this article, the best news is probably not that premiums are actually decreasing for many of the approximately 30 plan options available. Surveys show that Americans are more concerned about the price of their drugs than their plan premiums. So, more good news is that the cost of insulin – which has historically created something of a hardship for dependent diabetic patients – will be limited to a $35.00 monthly cap on insulin copays for Part D enrollees. In addition, all vaccines recommended for adults by the CDC will be available at no cost.
If not reversed, even greater cost savings are scheduled for 2024 and beyond. Here are some of the highlights:
2024
i) Part D enrollees entering the “catastrophic” phase of coverage will not owe any additional copays for the year. In other words, they will have 100% coverage.
ii) Part D premiums will be capped at a maximum price increase of 6% annually through 2029. Additionally, the government will expand eligibility for financial assistance.
2025
i) Out-of-pocket Medicare drug costs will be capped at $2,000 each year.
ii) Additionally, Part D enrollees will be able to spread out copay costs over the entire year, preventing hardship created by extremely high one-time bills.
2026
This will be the first year Medicare will be permitted to negotiate the cost of drugs. This will be limited to 10 drugs in 2026, increasing to 60 drugs by 2029.
These proposed changes all sound encouraging. Let us hope they survive to fruition. In the meantime, it is my job to assist my clients, and prospective clients, in identifying their lowest “total” cost Part D Drug plan for each calendar year. While people get fixated with monthly premium, one’s lowest total cost is the sum of their plan’s premium + any deductible due before their drugs become available for copays or coinsurance + their copays or coinsurance. We are seeking the lowest sum. It can be a tedious and confusing task for many and I assume that task for any client or prospective client requesting assistance.
For 2023 plan marketing, Medicare mandates I post the following disclaimer:
While I offer most, “I do not offer every plan available in your area. Please contact Medicare.gov or call 1-800-MEDICARE to get information on all your options.”
That being dispensed with, permit me to add – When someone requests I research the market for their lowest “total” cost drug or Medicare Advantage Plan, I not only employ proprietary software, but I utilize Medicare’s own data to make my recommendation. So rest assured, I have thoroughly reviewed all their options in the market before making my recommendation.
I do not charge a fee for my services. If you do not take advantage of my recommendation, you are out of nothing but the time we have spent together in arriving at it. However, if I introduce you to an insurance product, and you elect to apply for it, I only hope you will go through me to do so. You are not obligated to. Then, and only then, will I be compensated directly by the insurance company whose product you elect. The key to you is – you will pay no more premium for that product than if you were to walk in the front door of that company and purchase it directly from them. All companies in the Medicare Part D and Medicare Advantage market pay me the same so my objectivity is assured. Therefore, I like to think, you gain all the expertise my 36 years in the industry has to offer you at no additional charge. This is as opposed to a different person each time at the end of a toll-free number. I encourage you to take advantage of my offer and I look forward to establishing a working relationship with you.
D. Kenton Henry
All Plan Med Quote
Https://TheWoodlandsTXHealthInsurance.com Https://Allplanhealthinsurance.com Https://HealthandMedicareInsurance.com Office: 281-367-6565 Text my cell 24/7 @ 713-907-7984
CMS: Medicare Part B Premiums, Deductibles Will Decrease in 2023
Monthly Medicare Part B premiums will fall to $164.90 in 2023, marking a $5.20 decrease from this year, while Part A premiums are set to increase by $4 to $7.
September 27, 2022 – Medicare Part B premiums and deductibles will decrease in 2023, while Part A costs will rise, according to a fact sheet released by CMS.
Medicare Part B offers coverage for physician services, outpatient hospital services, certain home healthcare services, durable medical equipment (DME), and other medical services not covered by Medicare Part A.
The standard monthly premium for Part B enrollees will be $164.90 compared to $170.10 in 2022. The annual deductible will be $226, decreasing $7 from $233 in 2022.
Individuals with Medicare who take insulin through a pump supplied through the Part B DME benefit will not have to pay a deductible starting on July 1, 2023. In addition, cost-sharing will be capped at $35 for a one-month supply of covered insulin.
In 2023, Medicare beneficiaries who are 36 months post-kidney transplant can choose to continue Part B coverage of immunosuppressive drugs despite no longer being eligible for full Medicare coverage. These individuals will have to pay a monthly premium of $97.10 for immunosuppressive drug coverage.
Medicare beneficiaries with incomes greater than $97,000 will have higher Part B premiums. For example, monthly premiums will range from $230.80 to $560.50 for high-income beneficiaries. Similarly, monthly immunosuppressive drug coverage premiums will vary from $161.80 to $485.50 for high-income beneficiaries.
The While Part B costs will decrease in 2023, Part A costs are set to increase.
Medicare Part A offers coverage for inpatient hospital services, skilled nursing facility care, hospice care, inpatient rehab, and home healthcare services.
The Medicare Part A inpatient hospital deductible for beneficiaries admitted to the hospital will be $1,600 in 2023, rising from $1,556 in 2022. This deductible covers beneficiaries’ share of costs for the first 60 days of inpatient hospital care.
For days 61 through 90 of hospitalization, beneficiaries will have to pay a coinsurance amount of $400 per day, up from $389 in 2022. Past 90 days, the coinsurance will rise to $800 per day. The daily coinsurance for individuals in skilled nursing facilities will be $200 for days 21 through 100 of extended care services, up from $194.50 in 2022.
The majority of Medicare beneficiaries do not have to pay a Part A premium because they have worked at least 40 quarters in their life, the fact sheet noted. However, for those who have not, 2023 premiums are increasing.
Individuals who have at least 30 quarters of coverage or were married to someone with at least 30 quarters of coverage will have a Part A monthly premium of $278 in 2023, compared to $274 in 2022.
Individuals with less than 30 quarters and those with disabilities will have to pay the full 2023 premium of $506 per month, which is $7 higher than in 2022.
The fact sheet also shared 2023 information on Medicare Part D costs. Premiums for Medicare Part D, which offers drug coverage, vary from plan to plan. Around two-thirds of beneficiaries pay premiums directly to their plan, while the other third have their premiums deducted from their Social Security benefit checks.
Beneficiaries with incomes above $97,000 must also pay an income-related monthly adjustment amount in addition to their Part D premium. The amounts will range from $12.20 to $76.40 for high-income beneficiaries.
September 02, 2021 – The Alliance of Community Health Plans (ACHP) is urging the federal government to take action and lower prescription drug prices with a set of recommended actions.
The costs of prescription drugs continue to rise each year, but policymakers have done little to address it. ACHP’s list of suggestions ranges from increasing drug pricing transparency to expanding the use of biosimilars.
Catastrophic Medicare Part D prescription drug spending has been on the rise for over a decade. Seniors do not have an out-of-pocket cap for Medicare Part D, which can leave them with high costs in the catastrophic phase.
ACHP’s first recommendation is to redesign the Medicare Part D benefit including creating an out-of-pocket healthcare spending cap for seniors and to ensure that consumers will not owe anything during the catastrophic phase. Drug companies should also have to assume financial responsibility for each Part D phase and take some of the pressure off of Medicare.
Medicare should also receive resources to allow the program to negotiate lower drug prices for their beneficiaries, ACHP suggested.
ACHP’s next recommendation was for the federal government to allow the US Department of Health and Human Services (HHS) to negotiate prices for expensive prescription drugs that have no generic or biosimilar competition. These drugs were responsible for 60 percent of Part D spending in 2019, the fact sheet noted.
Currently, HHS has no power over competitive drug pricing.
Policymakers should also extend price negotiation to the commercial market to keep drug companies from shifting costs to non-Medicare consumers.
High-cost drugs that face no competition should also have an International Pricing Index applied that will limit the price to no more than 120 percent of its average international market price. The previous administration supported a similar approach through its Most Favored Nation model, but the Biden administration has proposed to rescind that model.
ACHP also urged the federal government to increase the use of biosimilars by informing clinicians and patients of the products and by persuading the Federal Trade Commission to increase biosimilar presence on the drug market. There are 29 FDA-approved biosimilars that are more affordable than other prescription drugs, but less than 12 are available on the market.
Increasing reimbursement rates for biosimilars could also improve utilization, the fact sheet stated.
ACHP’s suggestions also targeted drug companies’ unjustifiable raising of drug prices. At the beginning of 2021, 735 drugs prices increased up to 10 percent without reason.
Prescription drug prices often increase faster than the inflation rate, therefore ACHP recommended that drug manufacturers should have to provide rebates for drug price increase above the inflation rate.
Drug companies should also have to follow a price transparency rule that would require manufacturers to report and justify price increases, ACHP stated.
One example is the FAIR Drug Pricing Act, introduced in the Senate in 2019 and referred to the Committee on Health, Education, Labor, and Pensions. This Act would require drug manufacturers to notify HHS and submit a transparency and justification report 30 days before increasing the price of certain drugs by more than 10 percent.
Lastly, the ACHP recommended that the federal government encourage the use of transparent fee-based pharmacy benefit managers (PBMs). Traditional PBMs are typically not transparent about rebates, which can encourage high-cost drug use, whereas transparent fee-based PBMs pass rebates and discounts onto payers and earn revenue through a clear administrative fee.
Payer organizations have turned to the federal government to get prescription drug prices under control, as pharmaceutical companies are not budging.
In January 2021, AHIP called on the Biden Administration to focus on solutions that would protect Americans from higher drug prices.
The issue is pressing, not only for the seniors on whom some of ACHP’s recommendations focused but for all Americans. AHIP reported that the highest portion of commercial health insurance premiums goes toward prescription drug costs, making prescription drug pricing a widespread concern.
While inflation has costs for necessities, such as gas and food items, skyrocketing to an average of 8.5% in March and much higher for the aforementioned items – Social Security saw fit to only increase the Income Benefit to SSI recipients to 5.9%. Seniors, many of whom are subsisting on fixed incomes, might be able to cut their need for gasoline, but I do not know any who can get by without food, shelter, and electricity. Many are struggling to pay their bills already, and inflation shows little sign of abating.
This was only until 09/2021, at which time, apparently only apples inflated lower than our current rate of inflation.
But how about the argument that all this inflation is due to Putin and the war in Ukraine? Russia launched a full-scale assault on Ukraine February 22. One month after the end of the timeline in the chart below.
When was our current president inaugurated? . . . Answer: January 20, 2021. Take a look at the green line above charting the Consumer Price Index on that date. (I will leave it at that.)
To add insult to injury, the Centers for Medicare and Medicaid Services (CMS) increased Part B (outpatient care) premiums by 15% to a base premium -for those with an annual income of less than or equal to $91,000 – to $170.10 per month. Thank you very much!
However, as described in Feature Article 1 below, due in part to a 50% cut in the cost of a $56,000 Part D covered drug, CMS is considering reducing that Part B Premium. My experience is that the government seldom gives back what they are already receiving . . . but one can only hope.
For those involved in Marketplace medical coverage – health insurance for individuals and families under the age of 65 – the opposite action on the part of the Department of Health and Human Services may occur. Specifically, the extended enhanced premium tax credits made available by the American Rescue Plan, which enabled an additional 3 million Americans to receive a subsidy lowering their net monthly premium to as low as $0, are set to expire at the end of the year. As described in Feature Article 3 below, it is estimated 4.9 million more people will go uninsured if enhanced benefits are not extended. Never mind it is estimated the extension of such would increase the federal deficit by $305 billion dollars. Of course, the Treasury can simply print more money, further increasing inflation and diminishing the buying power of one’s paycheck or Social Security Income.
Lastly, medical expenses are no exception to inflation. If you wonder why health insurance premiums or out-of-pocket costs for healthcare are being affected, refer to article 3 below. They start high and increase as one goes from a doctor’s office to an Urgent Care facility to a hospital emergency room. Avoid the latter unless it is a true emergency because it will cost an average of $444 for low to moderate severity treatment. Heaven, forbid you have an overnight stay in a hospital without medical insurance because the average cost is $11,700. As cited in the chart below, it only goes up depending on the type of insurance you have.
Should your stay extend to three days, expect to cost to be an average of $30,000. And what if you don’t have health insurance? Here are the average costs of various treatments.
Take a look at what you might pay for each hospital bill without insurance:
*(Data from the Agency for Healthcare Research and Quality)
While I cannot guarantee we have seen the worst of inflation – let alone that the government is going to provide us any meaningful relief in the immediate future. But I am here to assist you in acquiring medical coverage, which gives you access to the care and treatment you need to regain or preserve your health without being financially ruined. I will do my best to help you maintain access to as many of your preferred medical doctors and hospitals as the present market allows. I do not charge a fee for my services. There is no additional cost for the insights and value of my 36 years of experience in the health and Medicare-related insurance market. Neither is there any additional cost in acquiring an insurance product through me than if you walked through the door of your preferred insurance company and purchased their product directly from them. There is no obligation to take my learned advice.
Please give me a call and let’s discuss your situation before the very busy “Open Enrollment” Periods are upon us and everyone is scrambling to mitigate what are almost certain to be the increasing costs of health care
AHIP applauded CMS for covering the drug and “related services such as PET scans if required b the trial protocol.”
Other stakeholders said that now the coverage decision has been finalized it is time for CMS to take action on lowering Part B premiums.
CMS has yet to announce any final decision on Part B premiums, which is increased by 15% for 2022. A key reason was the $56,000 price tag for Aduhelm.
However, Department of Health and Human Services Secretary Xavier Becerra announced in January that the agency was rethinking the 15% hike after Biogen halved the price of Aduhelm in December.
Becerra told reporters on Tuesday before the coverage decision that he was waiting to see what “CMS gives back to us in terms of their assessment and then once we get that information we will see where we go.”
CMS told Fierce Healthcare on Friday that it has yet to decide on a redetermination for the premium.
But advocates are hoping the agency moves faster on scaling back the premium hike.
“Medicare beneficiaries struggling to pay their bills need relief from this year’s premium increase as soon as possible,” said Max Richtman, president and CEO of the National Committee to Preserve Social Security and Medicare.
Pharma and Alzheimer’s disease patient advocacy groups slammed the decision, however, noting that it will hamper access to the drug.
“CMS has further complicated matters by taking the unprecedented step of applying different standards for coverage of medicines depending on the FDA approval pathway taken, undermining the scientific assessment by experts at FDA,” said Nicole Longo, spokeswoman for the Pharmaceutical Research and Manufacturers of America, in a statement.
End to ACA tax credits could leave 3 million uninsured
But extending the enhanced credits would increase the federal deficit by $305 billion over 10 years.
By Alan Goforth | April 08, 2022 at 09:32 AM
Congress would need to act by midsummer to give marketplaces, insurers and outreach programs time to prepare for the 2023 open enrollment period.
More than three million people could lose insurance coverage if enhanced premium tax credits included in the American Rescue Plan expire at the end of this year, according to a new report from the Urban Institute. The American Rescue Plan Act of 2021 increased credits for Marketplace insurance coverage and extended eligibility to more individuals.
“If Congress does not extend these benefits, marketplace enrollment will most likely fall and the number of people uninsured will increase,” said Jessica Banthin, senior fellow at the organization. “Our findings show that 4.9 million fewer people will be enrolled in subsidized Marketplace coverage in 2023 if the enhanced credits aren’t extended. This comes at a pivotal time when millions of people will be losing Medicaid as the public health emergency expires.
Average charges for 8 common procedures across ER, retail and urgent care settings
Alia Paavola – Wednesday, March 30th, 2022
In 2020, the median charge for a 30- to 44-minute new patient office visit ranged from $164 in a retail clinic to $234 in an urgent care center, according to a March report from Fair Health.
For the report, Fair Health, an independent nonprofit focused on enhancing transparency of healthcare costs and health insurance information, analyzed billions of private healthcare claims records from its database.
Below is the average charge for eight common procedures, as identified by CPT code, performed in retail, urgent care and emergency room settings:
TIME IS RUNNING OUT FOR A JANUARY 1 EFFECTIVE DATE!
Op-ed by D. Kenton Henry Editor, Broker 26 November 2021
In September, I learned Aetna and Unitedhealthcare would be reentering the Texas ACA Underage 65 health insurance market for the first time since 2015. Since then, BlueCross BlueShield has been the only “household name,” a large, financially sound insurance company in the southeast Texas market. This was most welcome news, and I was hopeful these additional peer companies would allow my clients and fellow Texans access to more doctors and hospitals. Finding my client’s preferred doctors and hospitals in a plan network has been my client’s and my greatest challenge since the departure of all PPO network options six years ago. Alas, the hoped-for provider expansion in 2022, at this point, has failed to materialize. From 2015 into 2021, the St. Lukes Hospital system has been the only major hospital system participating in most insurance companies’ HMO networks. Such will remain the case for 2022.
Additionally, the entry of Bright Insurance Company (for the first time) doesn’t even appear to do that. They will limit their policyholder’s access to hospitals will be limited to smaller HCA local community hospitals. At least for the time being.
Doctors have practicing privileges at one or more hospitals. Of course, it follows that when an insurance company has fewer hospitals in their network, they will have fewer participating doctors. And so it seems. Only one health insurance company in the southeast Texas ACA health insurance market allows its clients access to the three major hospital systems in the area. Those hospitals are St. Luke’s, Memorial Hermann, and Houston Methodist. And then, only if you acquire their more expensive Silver or Gold plans.
However, there is a bit of good news for all Americans in the “Individual and Family” health insurance market. The federal government’s American Rescue Plan has increased the amount of Advance Premium Tax Credit (subsidy) and Cost Sharing Reduction (reduction of deductibles, copays, and coinsurance) available to a household. It also expanded the eligibility for these subsidies. As the feature article below explains, this will qualify more people for both types of savings.
Furthermore, unemployment effects and increases your potential premium tax credit! The American Rescue Plan exempts up to $10,200 in UI benefits from federal income tax. People who receive UI benefits in 2020 will be able to reduce their adjusted gross income by up to that amount, and so reduce their federal income tax liability.
Please get in touch with me to learn the details on the aforementioned company providing the greatest access to providers and how the expanded subsidies and Cost-Sharing Reductions may improve your health insurance situation.
If you choose to be proactive and would like to do some reconnaissance before calling me for assistance and details, you may click on my quoting link immediately following. When the page opens, ignore the login button. You need not log in. Enter your information. I.e., birth date, zip code, etc. On the next page, click on the top box “SELECT ALL” to clear the selections. Then select “MEDICAL” only, to get started. Otherwise, you will be overwhelmed with options and information. You can always return for dental, etc.)
Click “YES” if you would like to estimate whether you qualify for a subsidy. If so, enter your estimated annual income in 2022 and click “CALCULATE”. It will estimate your subsidy. The estimates are usually accurate to within $3.00. From there, click “NEXT”. You will then see all your plan options and be able to LOOKUP PROVIDERS and see plan details. Or simply call me to do all this for you!
CLICK HERE TO SEE ALL YOUR ACA HEALTH INSURANCE OPTIONS (IF NECESSARY, COPY THE LINK IN YOUR BROWSER AND HIT ENTER):
As the cost for everything, including medical treatment, is going up, so too are Medicare’s premiums and deductibles. As our second feature article below illustrates, the Medicare Part B (outpatient) basic premium is going from $148.50 to $170.10 and it’s calendar year deductible is going from $203.00 to $233.00! You can do the math, but, needless to say, so much for 5% inflation rate projected by the current administration which also does not appear to apply to our cost for gasoline, meat, and energy and food, in general! You’ve already spent the increase in your Social Security Benefit!
The details of how your Medicare Part B basic premium will may titrate upward relative to your income are clearly outlined in Feature Article 2, just published by the Centers For Medicare and Medicaid Services.
Lastly, if you are making the decision whether to go with a Medicare Advantage Prescription Drug Health Plan vs. a Medicare Supplement policy coupled with a Part D Prescription Drug Plan – please read Feature Article 3 (say it ain’t so, Joe!) below, and carefully weigh your decision.
Again, please contact me for guidance in how to minimize the impact of these changes and maximize your both your access to providers and quality health care. My 35 years specializing in the health and Medicare related insurance industry have provided me insights beyond that of the average agent/broker/generalist; and my clients access to a far greater number of products and solutions.
Advanced Premium Tax Credits(APTC):Lowers the cost of premiums and can be used on any Marketplace plan except for catastrophic plans.
Cost Sharing Reductions(CSR):Lowers the cost of deductibles and can only be applied to Marketplace Silver plans.
This year, many people will qualify for both types of savings!
Why are subsidies more generous this year:
The American Rescue Plan Act increased the amount of APTC and CSR available to a household, and it also expanded the eligibility for these subsidies.
Silver plans vs. other metal levels:
All Marketplace health insurance plans are broken into five types: Platinum, Gold, Silver, Bronze and Catastrophic. You can expect the same level of care fromall metal levels. The difference is how your healthcare costs will be split between you and the insurance company. Metal levels Premium Platinum Highest Gold Silver Bronze Catastrophic Deductible Higher Middle Lower Lowest Lower Middle Higher Highest. If you are eligible for a CSR, you must choose a Silver plan!
On November 12, 2021, the Centers for Medicare & Medicaid Services (CMS) released the 2022 premiums, deductibles, and coinsurance amounts for the Medicare Part A and Part B programs, and the 2022 Medicare Part D income-related monthly adjustment amounts.
Medicare Part B Premium and Deductible
Medicare Part B covers physician services, outpatient hospital services, certain home health services, durable medical equipment, and certain other medical and health services not covered by Medicare Part A.
Each year the Medicare Part B premium, deductible, and coinsurance rates are determined according to the Social Security Act. The standard monthly premium for Medicare Part B enrollees will be $170.10 for 2022, an increase of $21.60 from $148.50 in 2021. The annual deductible for all Medicare Part B beneficiaries is $233 in 2022, an increase of $30 from the annual deductible of $203 in 2021.
The increases in the 2022 Medicare Part B premium and deductible are due to:
Rising prices and utilization across the health care system that drive higher premiums year-over-year alongside anticipated increases in the intensity of care provided.
Congressional action to significantly lower the increase in the 2021 Medicare Part B premium, which resulted in the $3.00 per beneficiary per month increase in the Medicare Part B premium (that would have ended in 2021) being continued through 2025.
Additional contingency reserves due to the uncertainty regarding the potential use of the Alzheimer’s drug, Aduhelm™, by people with Medicare. In July 2021, CMS began a National Coverage Determination analysis process to determine whether and how Medicare will cover Aduhelm™ and similar drugs used to treat Alzheimer’s disease. As that process is still underway, there is uncertainty regarding the coverage and use of such drugs by Medicare beneficiaries in 2022. While the outcome of the coverage determination is unknown, our projection in no way implies what the coverage determination will be, however, we must plan for the possibility of coverage for this high cost Alzheimer’s drug which could, if covered, result in significantly higher expenditures for the Medicare program.
Medicare Open Enrollment and Medicare Savings Programs
Medicare Open Enrollment for 2022 began on October 15, 2021, and ends on December 7, 2021. During this time, people eligible for Medicare can compare 2022 coverage options between Original Medicare, and Medicare Advantage, and Part D prescription drug plans. In addition to the recently released premiums and cost sharing information for 2022 Medicare Advantage and Part D plans, the Fee-for-Service Medicare premiums and cost sharing information released today will enable people with Medicare to understand all their Medicare coverage options for the year ahead. Medicare health and drug plan costs and covered benefits can change from year to year, so people with Medicare should look at their coverage choices annually and decide on the options that best meet their health needs.
To help with their Medicare costs, low-income seniors and adults with disabilities may qualify to receive financial assistance from the Medicare Savings Programs (MSPs). The MSPs help millions of Americans access high-quality health care at a reduced cost, yet only about half of eligible people are enrolled. The MSPs help pay Medicare premiums and may also pay Medicare deductibles, coinsurance, and copayments for those who meet the conditions of eligibility. Enrolling in an MSP offers relief from these Medicare costs, allowing people to spend that money on other vital needs, including food, housing, or transportation. People with Medicare interested in learning more can visit: https://www.medicare.gov/your-medicare-costs/get-help-paying-costs/medicare-savings-programs.
Medicare Part B Income-Related Monthly Adjustment Amounts
Since 2007, a beneficiary’s Part B monthly premium is based on his or her income. These income-related monthly adjustment amounts affect roughly 7 percent of people with Medicare Part B. The 2022 Part B total premiums for high-income beneficiaries are shown in the following table:
Beneficiaries who file individual tax returns with modified adjusted gross income:
Beneficiaries who file joint tax returns with modified adjusted gross income:
Income-related monthly adjustment amount
Total monthly premium amount
Less than or equal to $91,000
Less than or equal to $182,000
$0.00
$170.10
Greater than $91,000 and less than or equal to $114,000
Greater than $182,000 and less than or equal to $228,000
68.00
238.10
Greater than $114,000 and less than or equal to $142,000
Greater than $228,000 and less than or equal to $284,000
170.10
340.20
Greater than $142,000 and less than or equal to $170,000
Greater than $284,000 and less than or equal to $340,000
272.20
442.30
Greater than $170,000 and less than $500,000
Greater than $340,000 and less than $750,000
374.20
544.30
Greater than or equal to $500,000
Greater than or equal to $750,000
408.20
578.30
Premiums for high-income beneficiaries who are married and lived with their spouse at any time during the taxable year, but file a separate return, are as follows:
Beneficiaries who are married and lived with their spouses at any time during the year, but who file separate tax returns from their spouses, with modified adjusted gross income:
Income-related monthly adjustment amount
Total monthly premium amount
Less than or equal to $91,000
$0.00
$170.10
Greater than $91,000 and less than $409,000
374.20
544.30
Greater than or equal to $409,000
408.20
578.30
Medicare Part A Premium and Deductible
Medicare Part A covers inpatient hospital, skilled nursing facility, hospice, inpatient rehabilitation, and some home health care services. About 99 percent of Medicare beneficiaries do not have a Part A premium since they have at least 40 quarters of Medicare-covered employment.
The Medicare Part A inpatient hospital deductible that beneficiaries pay if admitted to the hospital will be $1,556 in 2022, an increase of $72 from $1,484 in 2021. The Part A inpatient hospital deductible covers beneficiaries’ share of costs for the first 60 days of Medicare-covered inpatient hospital care in a benefit period. In 2022, beneficiaries must pay a coinsurance amount of $389 per day for the 61st through 90th day of a hospitalization ($371 in 2021) in a benefit period and $778 per day for lifetime reserve days ($742 in 2021). For beneficiaries in skilled nursing facilities, the daily coinsurance for days 21 through 100 of extended care services in a benefit period will be $194.50 in 2022 ($185.50 in 2021).
Part A Deductible and Coinsurance Amounts for Calendar Years 2021 and 2022 by Type of Cost Sharing
2021
2022
Inpatient hospital deductible
$1,484
$1,556
Daily coinsurance for 61st-90th Day
$371
$389
Daily coinsurance for lifetime reserve days
$742
$778
Skilled Nursing Facility coinsurance
$185.50
$194.50
Enrollees age 65 and over who have fewer than 40 quarters of coverage and certain persons with disabilities pay a monthly premium in order to voluntarily enroll in Medicare Part A. Individuals who had at least 30 quarters of coverage or were married to someone with at least 30 quarters of coverage may buy into Part A at a reduced monthly premium rate, which will be $274 in 2022, a $15 increase from 2021. Certain uninsured aged individuals who have less than 30 quarters of coverage and certain individuals with disabilities who have exhausted other entitlement will pay the full premium, which will be $499 a month in 2022, a $28 increase from 2021.
Medicare Part D Income-Related Monthly Adjustment Amounts
Since 2011, a beneficiary’s Part D monthly premium is based on his or her income. These income-related monthly adjustment amounts affect roughly 8 percent of people with Medicare Part D. These individuals will pay the income-related monthly adjustment amount in addition to their Part D premium. Part D premiums vary from plan to plan and roughly two-thirds are paid directly to the plan, with the remaining deducted from Social Security benefit checks. The Part D income-related monthly adjustment amounts are all deducted from Social Security benefit checks. The 2022 Part D income-related monthly adjustment amounts for high-income beneficiaries are shown in the following table:
Beneficiaries who file individual tax returns with modified adjusted gross income:
Beneficiaries who file joint tax returns with modified adjusted gross income:
Income-related monthly adjustment amount
Less than or equal to $91,000
Less than or equal to $182,000
$0.00
Greater than $91,000 and less than or equal to $114,000
Greater than $182,000 and less than or equal to $228,000
12.40
Greater than $114,000 and less than or equal to $142,000
Greater than $228,000 and less than or equal to $284,000
32.10
Greater than $142,000 and less than or equal to $170,000
Greater than $284,000 and less than or equal to $340,000
51.70
Greater than $170,000 and less than $500,000
Greater than $340,000 and less than $750,000
71.30
Greater than or equal to $500,000
Greater than or equal to $750,000
77.90
Premiums for high-income beneficiaries who are married and lived with their spouse at any time during the taxable year, but file a separate return, are as follows:
Beneficiaries who are married and lived with their spouses at any time during the year, but file separate tax returns from their spouses, with modified adjusted gross income:
Joe Namath may have delivered the New York Jets’ last Super Bowl championship, but the old quarterback is throwing a bunch of bull on his TV commercials for private Medicare plans.
He’s one of a slew of pitchmen and women selling Medicare Advantage plans to the more than 54 million Americans 65 or over eligible for Medicare. That includes more than 100,000 of us in Orange, Ulster and Sullivan counties.
Joe Namath may have delivered the New York Jets’ last Super Bowl championship, but the old quarterback is throwing a bunch of bull on his TV commercials for private Medicare plans.
Those pitches, which also flood our mailboxes during this enrollment period that ends Dec. 7, complicate what can be a mind-boggling array of insurance choices.
First, some basic facts:
Medicare Advantage is the all-in-one alternative to original Medicare health insurance. Original Medicare includes coverage for hospitalization (Part A), medical visits and procedures (Part B) and, at additional cost, prescription drugs (Part D). Before you enroll in Advantage plans, you must have original Medicare, and you still must pay the Part B premium of $148.50 (in 2021). While Medicare Advantage plans include medical, hospital and drug coverage, they can also feature extra benefits not offered by traditional Medicare, such as dental, hearing and vision coverage with no additional premium.
Especially in those pitches from celebrities like Namath, William Shatner and Jimmie Walker, they can also promise everything from free meal delivery to money deposited in your Social Security account.
But …
“Buyer beware,” says Erinn Braun, Orange County Office for the Aging’s Health Insurance Counseling and Assistance Program coordinator. She provided much information for this column.
Pitches like Namath’s can be misleading or downright deceptive, starting with the red, white and blue colors that insinuate the ads are from the government, as do the state logos on some mailers. While the plans themselves are perfectly legal and may be great for many of the 27 million Americans enrolled in them, they often don’t deliver everything those pitches seem to promise. Plus, those pitches don’t come close to telling the full story of the benefits of those plans – many of which aren’t even offered in your area.
For instance:
Unlike original Medicare, which is accepted by virtually all doctors and hospitals, Medicare Advantage plans include a network of doctors and hospitals you must visit to be insured. So if you hear about a great gastroenterologist in New York City and she isn’t in your Advantage plan’s network, your insurance may not cover your visit. Plus, unlike original Medicare, you may need prior approval for coverage of a medical procedure or equipment such as insulin pumps.
And while the dental and vision coverage of Medicare Advantage plans sounds great, some plans in your area may only include routine visits, not more expensive items like dental implants and eyeglasses. Plus, the average yearly coverage limit of Advantage dental plans ranges from about $1,000 to $1,300, according to the Kaiser Family Foundation. The dentists and eye doctors you visit must also be in the plan’s networks – meaning your eye doctor or dentist may not accept your plan.
Steve Israel
As for those meals and money Joe Willie is pitching?
Again, buyer beware.
A few Advantage plans may offer meal delivery for the qualified but only one or two plans in your county may offer those benefits. And your doctors or hospital may not accept those plans. Same thing goes for that money Namath says could go into your Social Security account. Not only does that money go toward the required payment for Part B of original Medicare, very few plans – if any – in your area may feature that benefit, and those plans may not include your doctors.
Finally, when you call the number provided by Namath and other pitch folks, you’ll reach a salesperson who’s in business to … you guessed it … sell you a Medicare Advantage plan.
For help selecting the right Medicare plan for you, contact your county’s Office of the Aging. Orange: 845-615-3710, Sullivan: 845-807-0241, Ulster: 845-340-3456. A trusted health insurance agent can also help. Medicare.gov and 1-800-Medicare provide a wealth of information.


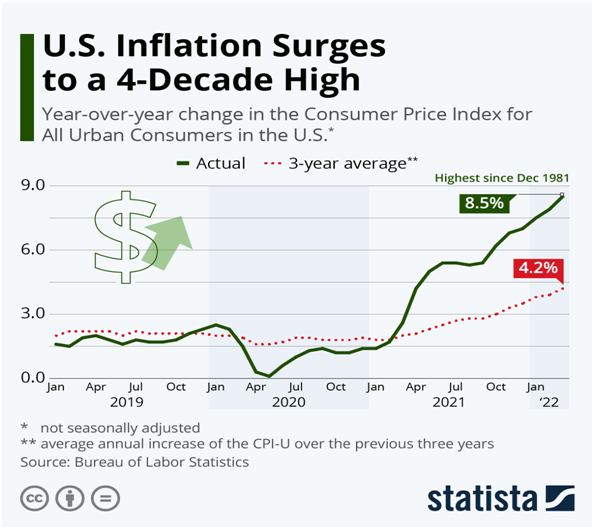
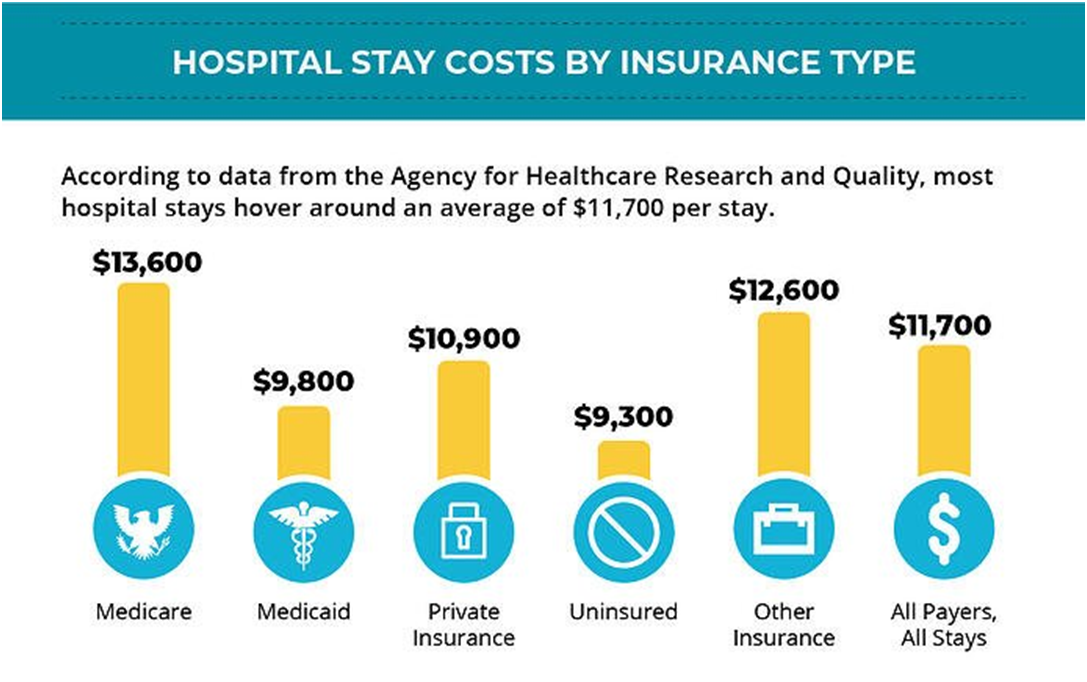


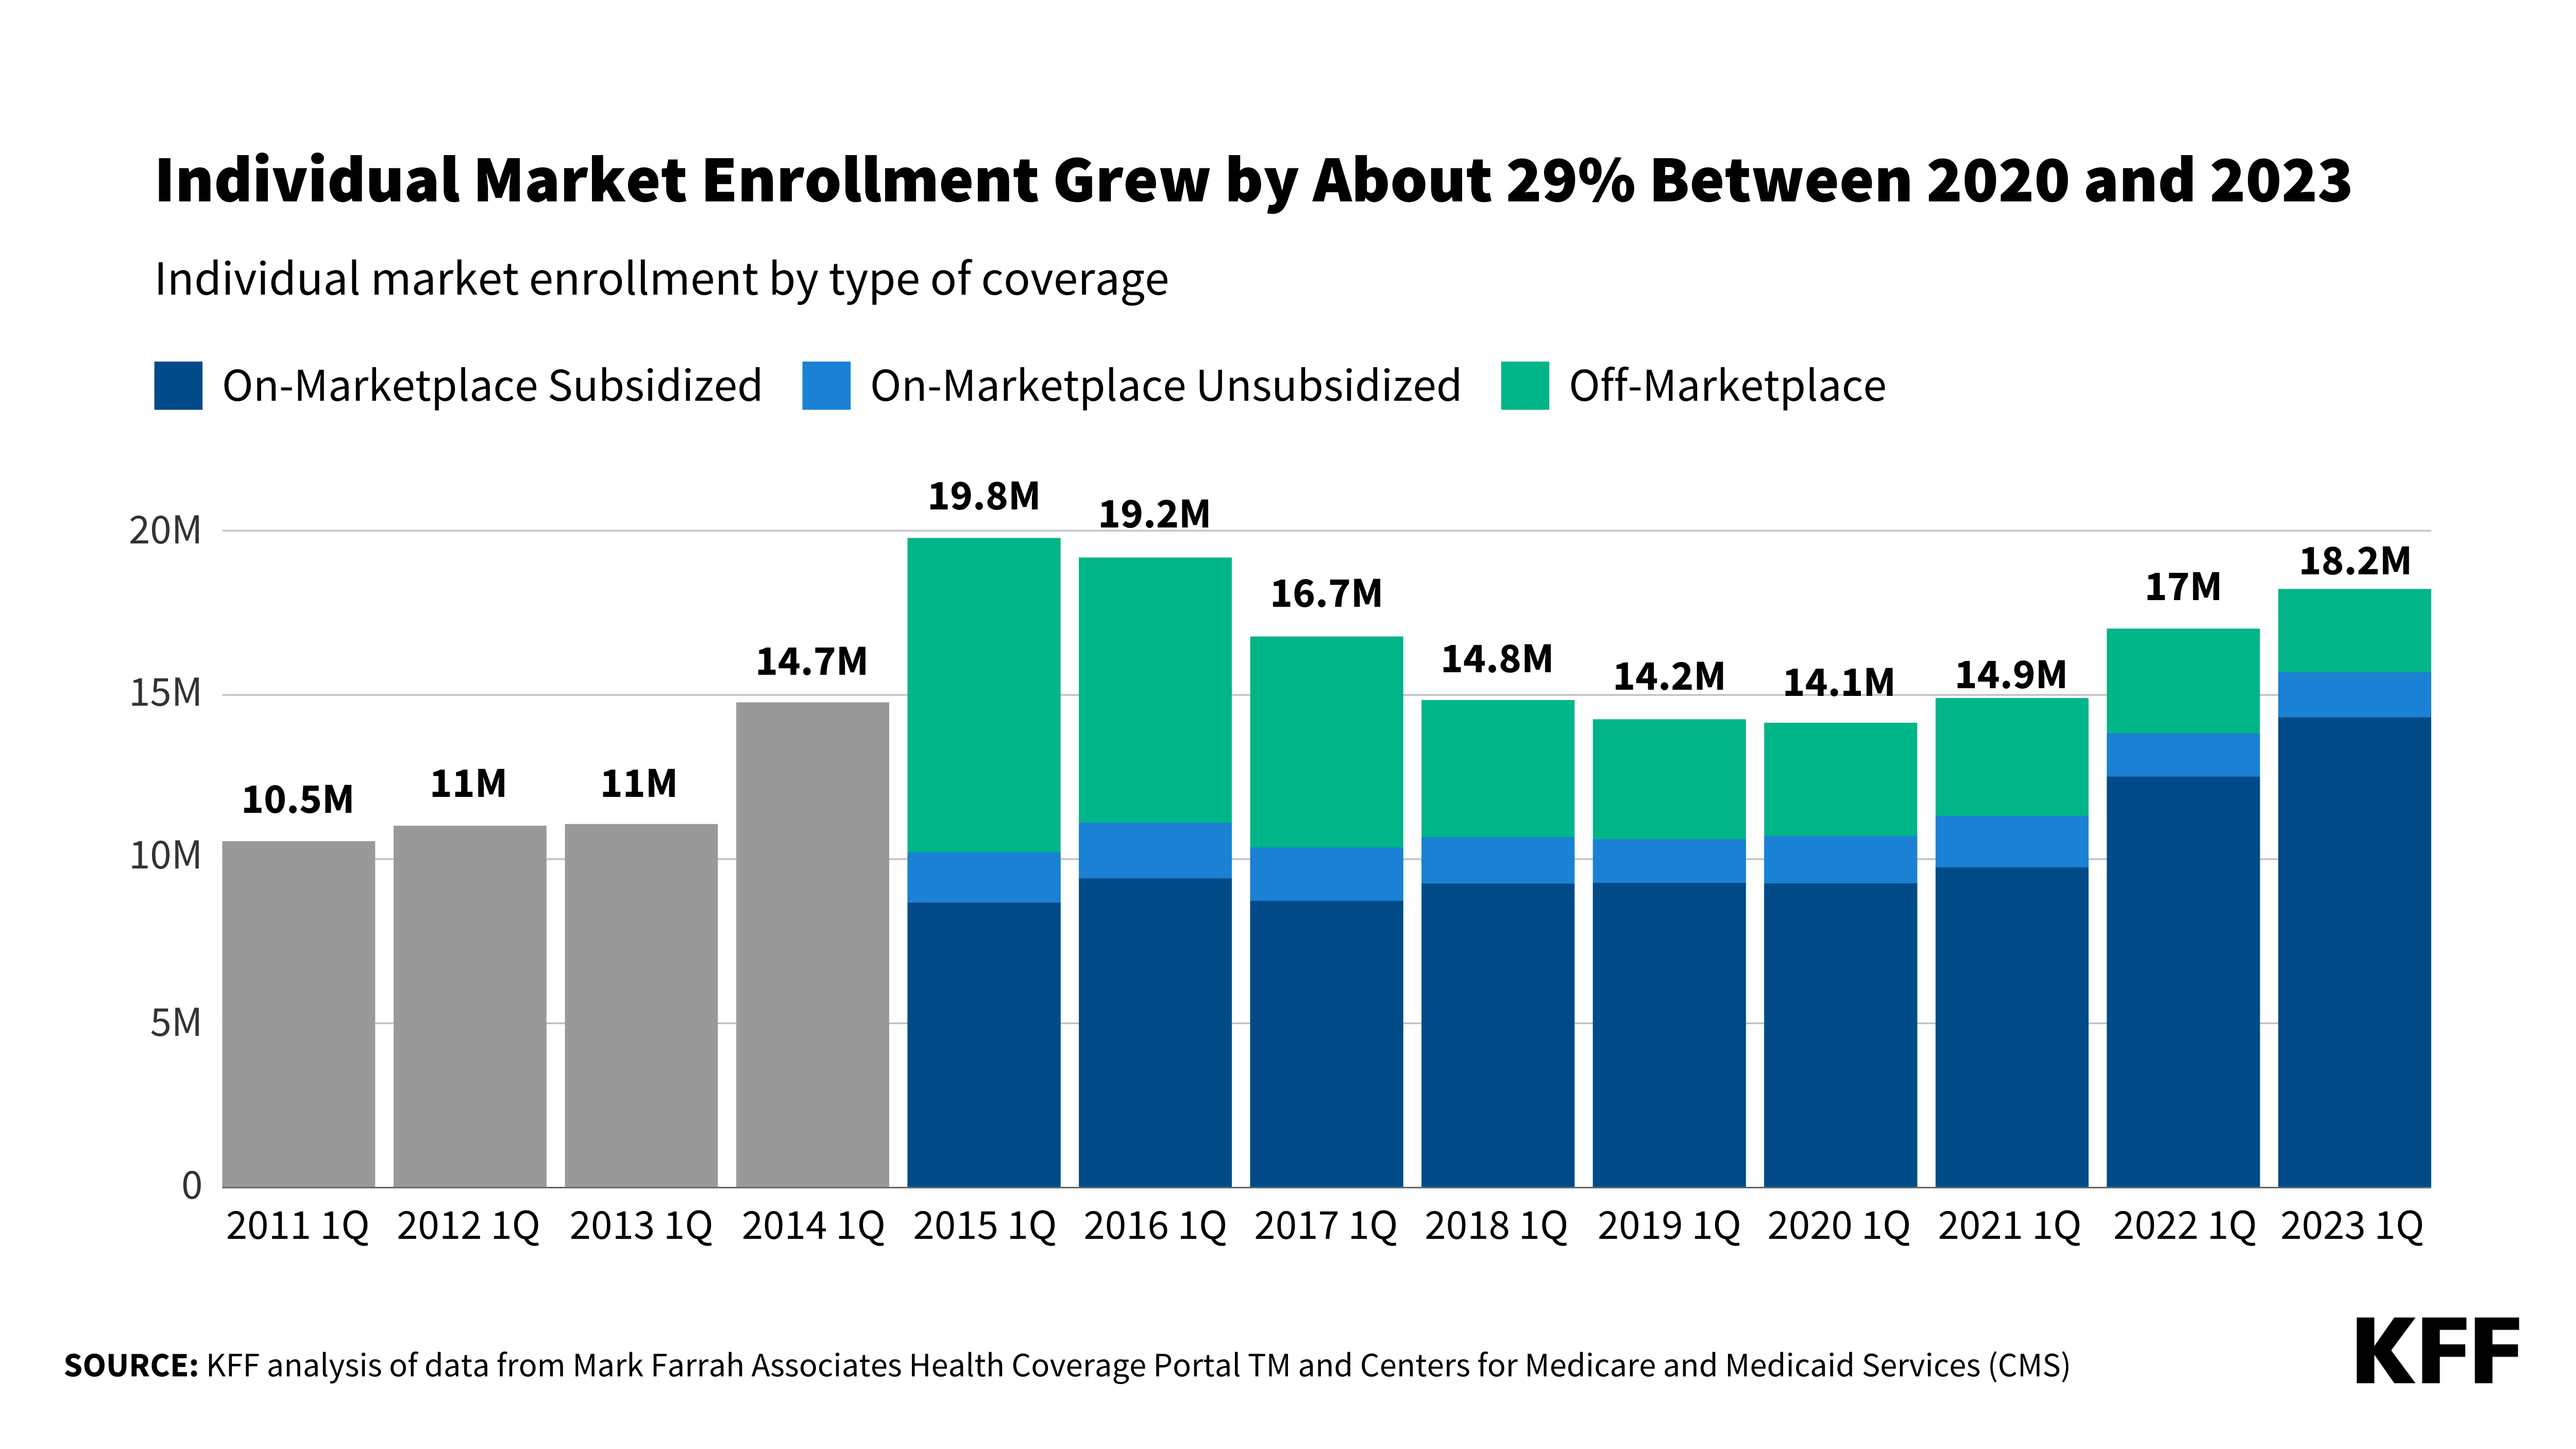
Leave a comment