

By D. Kenton Henry
Editor, Broker, Agent
9 August 2024
For all Americans seeking to obtain or renew “Individual and Family” health insurance in 2025, there are (as always) certain changes to be anticipated.
Open Enrollment Period (OEP)—the period when all U.S. citizens may purchase health insurance for a January 1 effective date of the coming calendar year—runs from November 1st to December 15th. For those who, for whatever reason, want a February 1 effective date—the cutoff is January 15th. After that, a person must qualify for a Special Election Period (SEP). The most common of these is “loss of coverage through no fault of one’s own. During a SEP, an individual has 60 days to pick a plan. That plan will become effective on the first of the month after the date of the application.
To begin, let’s get the negatives out of the way.
THE NEGATIVE:
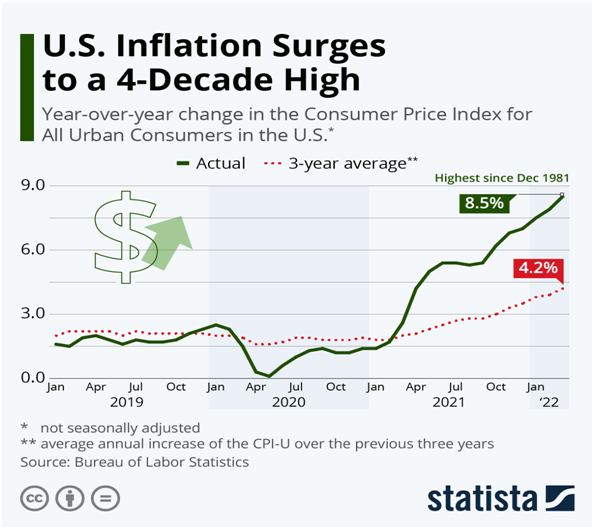
In 2025, ACA (Affordable Care Act) individual and family health insurance premiums are expected to increase by a median of 7%. This rise is driven by several key factors, including the increasing costs of hospital services, workforce shortages, and growing demand for high-cost specialty medications like GLP-1 drugs commonly used for weight loss and diabetes management (such as Ozempic). General inflation and healthcare provider consolidation are also contributing to these hikes.
Although most enrollees in ACA plans receive subsidies that will mitigate the impact of these increases, the cost burden on the federal government will grow as more funds will be needed to cover the subsidies. Insurers across the country are proposing premium increases that vary significantly, ranging from 5% to 10% on average, with some areas seeing rates fluctuate outside this range.
THE POSITIVE:
As we approach 2025, the Affordable Care Act (ACA) continues to evolve, aiming to address the shifting landscape of healthcare needs and to improve the accessibility and affordability of health insurance for individuals and families. The upcoming changes reflect ongoing efforts to enhance coverage, reduce costs, and ensure that more Americans have access to quality care. Here’s a comprehensive look at what you can expect from the ACA’s individual and family health insurance provisions in 2025.
1. Expanded Subsidies and Enhanced Affordability
One of the most significant changes coming in 2025 is the expansion of subsidies for health insurance premiums. Building on previous enhancements, such as those from the American Rescue Plan Act and the Inflation Reduction Act, the ACA will offer even more robust premium assistance. These expanded subsidies are designed to make health insurance more affordable for a broader range of income levels, particularly benefiting middle-income families who previously struggled with premium costs.
For 2025, the eligibility for premium tax credits will be extended, and the income thresholds for receiving assistance will be adjusted to account for inflation and rising living costs. This means that more individuals and families will qualify for financial help, reducing the burden of monthly premiums and making comprehensive coverage more accessible.
2. Increased Cost-Sharing Reductions
In addition to expanding premium subsidies, the ACA will also introduce enhanced cost-sharing reductions (CSRs). These reductions will lower out-of-pocket costs such as copayments, coinsurance, and deductibles for low- and moderate-income families. The aim is to make healthcare services more affordable at the point of care, not just in terms of monthly premiums.
The improved CSRs will be particularly beneficial for those who purchase coverage through the ACA marketplaces, ensuring that even the most essential health services, like prescription drugs and specialist visits, are within reach for more Americans.
3. Broader Coverage Options and Flexibility
The ACA will introduce more flexibility in plan design and coverage options starting in 2025. Health insurance plans available through the ACA marketplaces will offer a wider variety of coverage levels and network options, allowing individuals and families to choose plans that better match their specific needs and preferences.
For example, there will be more options for plans that cater to different health conditions or provide enhanced preventive care services. This diversification aims to address the diverse needs of the population and provide more tailored solutions to meet individual health requirements.
4. Enhanced Support for Mental Health and Substance Use Treatment
Recognizing the growing importance of mental health and substance use treatment, the ACA will place a stronger emphasis on coverage for these services in 2025. Insurance plans will be required to offer more comprehensive mental health benefits, including increased access to therapy, counseling, and substance use disorder treatment.
This change reflects a broader understanding of the integral role mental health plays in overall well-being and aims to reduce the barriers to accessing necessary mental health services.
5. Strengthened Protections Against Discrimination
The ACA will bolster protections against discrimination in health insurance. New regulations will ensure that insurers cannot deny coverage or charge higher premiums based on pre-existing conditions, gender, or other personal factors. Additionally, there will be greater oversight to ensure that insurance plans adhere to these non-discrimination policies.
These protections aim to create a more equitable healthcare system and to ensure that all individuals have fair access to health insurance, regardless of their personal circumstances.
6. Improvements to the Enrollment Process
The enrollment process for ACA health insurance plans will become more streamlined and user-friendly. In 2025, the federal and state-based marketplaces will introduce enhanced digital tools and support services to assist individuals and families with plan selection and enrollment. This includes improved online interfaces, more robust customer support, and clearer guidance throughout the enrollment period.
The goal is to reduce barriers to accessing coverage and to make it easier for people to navigate their options and secure the insurance that best fits their needs.
7. Emphasis on Preventive and Wellness Services
The ACA will continue to focus on preventive care and wellness services. In 2025, there will be increased incentives for health plans to cover preventive services without cost-sharing and to provide additional resources for wellness programs. This shift aims to encourage healthier lifestyles and early detection of potential health issues, ultimately reducing long-term healthcare costs and improving overall public health.
Conclusion:
The changes to the ACA’s individual and family health insurance provisions in 2025 represent a significant step forward in making healthcare more affordable, accessible, and equitable. With expanded subsidies, increased cost-sharing reductions, broader coverage options, and enhanced support for mental health, the ACA is set to offer even greater support to those in need. As these changes are implemented, individuals and families can expect a more supportive and responsive healthcare system that better meets their needs and helps them achieve better health outcomes.
*Please refer to Feature Articles 1 and 2 below the comments box for details on upcoming changes.
Whether you feel you qualify for an “Advanced Premium Tax Credit” (premium subsidy) or not, I can guide you through the process of determining such and enrolling in the plan of your choice for 2025. My years of experience specializing in medical insurance, including ever since ACA compliant plans became available on January 1, 2014, make the process go as quickly and smoothly as possible. Please contact me. There is no obligation to utilize my service and no charge for doing so. If you elect to acquire a policy I introduced you to, I only ask that you go through me to do so. You will be charged no more for the policy than if you walked through the front door of the insurance company and acquired it directly. I am currently appointed with every insurance company doing business in SE Texas; however, I represent you and your interests first and foremost.
Thank you for considering my service,

D. Kenton Henry, Jr
All Plan Med Quote
Office: 281-367-6565
Text my cell 24/7 @ 713-907-7984
Email: Allplanhealthinsurance.com@gmail.com
Https://TheWoodlandsTXHealthInsurance.com
Https://Allplanhealthinsurance.com
Https://HealthandMedicareInsurance.com
For Medicare Supplement Quotes click here:
https://applyformedsupp.com?npn=387509
******************************************************************************************************
FEATURE ARTICLE 1:
THE KAISER FAMILY FOUNDATION (KFF) – The independent source for health policy research, polling, and news.
The independent source for health policy research, polling, and news.
Tammie Smith
August 5th, 2024
Marketplace Insurers are Proposing a 7% Average Premium Hike for 2025 and Pointing to Rising Hospital Prices and GLP-1 Drugs as Key Drivers of Costs
ACA Marketplace insurers are proposing a median premium increase of 7% for 2025, similar to the 6% premium increase filed for 2024, according to a new KFF analysis of the preliminary rate filings. Insurers’ proposed rate changes – most of which fall between 2% and 10% – may change during the review process.
Although the vast majority of Marketplace enrollees receive subsidies and are not expected to face these added costs, premium increases generally result in higher federal spending on subsidies. The justifications insurers provide for these premium changes also shed light on what is driving health spending more broadly.
Insurers cite growing health care prices – particularly for hospital care – as a key driver of premium growth in 2025, as well as growing use of weight loss and other specialty drugs, according to KFF’s examination of publicly-available documents.
This year, increases in the prices insurers are paying for medical care tend to affect premiums more than growth in the utilization of care. Insurers say workforce shortages and hospital market consolidation, which can put upward pressure on health care costs and prices, are increasing 2025 health insurance premiums.
Meanwhile, growing demand for Ozempic, Wegovy, and other costly GLP-1 drugs, which are used to treat diabetes and obesity, is increasing prescription drug spending.
The full analysis and other data on health costs are available on the Peterson-KFF Health System Tracker, an online information hub dedicated to monitoring and assessing the performance of the U.S. health system.
********************************************************************************************************
FEATURE ARTICLE 2:
KFF The independent source for health policy research, polling, and news.
How Narrow or Broad Are ACA Marketplace Physician Networks?
Matthew Rae, Karen Pollitz, Kaye Pestaina, Michelle Long, Justin Lo, and Cynthia Cox
Published: Aug 26, 2024
One way insurers seek to control costs is to limit the size of the physician networks serving their plans. Providers agree to lower fees and other terms with insurers in order to be included in one or more of the networks they offer. Insurers then either limit coverage to services provided by network providers or encourage enrollees to use network providers through lower cost sharing. Reducing the number of providers in-network can effectively reduce plan costs, but it also limits enrollees’ choices, increases wait times, and can complicate the continuity of care for those switching plans. Enrollees receiving care from out-of-network providers often face coverage denials or substantially higher out-of-pocket expenses. These factors highlight how the size and composition of provider networks impact access to care and the financial protection insurance provides enrollees.
The breadth of provider networks in the Affordable Care Act (ACA) Marketplaces has been the subject of significant policy interest. Insurers often compete aggressively to be among the lowest-cost plans, potentially leaving enrollees with poor access. According to the 2023 KFF Survey of Consumer Experiences with Health Insurance, one in five (20%) consumers with Marketplace plans reported that in the past year, a provider they needed was not covered by their insurance, and nearly one in four (23%) said a provider they needed to see that was covered by their insurance did not have appointments available. Enrollees with Marketplace coverage were more likely than those with employer coverage to face these challenges. While the Centers for Medicare and Medicaid Services (CMS) establishes minimum standards for the adequacy of provider networks for Marketplace plans, insurers retain considerable flexibility in how they design networks and how many providers they include. As a result, the breadth of plan networks varies considerably within counties, presenting challenges for consumers who need to select a plan with little information on the network breadth of their options.
This brief examines the share of doctors participating in the provider networks of Qualified Health Plans (QHPs) offered in the individual market in the federal and state Marketplaces in 2021, and how network breadth affected costs for enrollees. The analysis uses data on the physician workforce, from 2021, matching that to provider networks in marketplace plans from the same year. Doctors filing Medicare Part B claims in or near each county are considered to be part of the active workforce available to Marketplace enrollees. Only doctors filing a claim and therefore known to have engaged in patient care in 2021 were included. The share of local physicians participating in a network is a rough measure of how much access enrollees have; depending on the number of providers in the area and the workloads of those physicians, enrollees in plans with similar breadths may face different wait times to book appointments. The share of local physicians participating in-network distinguishes whether enrollees have a broad or narrow choice of local doctors. Those in plans including a small share of doctors have fewer options when trying to find a provider with available appointments. See the Methods section for more details.
Key Findings
- On average, Marketplace enrollees had access to 40% of the doctors near their home through their plan’s network, with considerable variation around the average. Twenty-three percent of Marketplace enrollees were in a plan with a network that included a quarter or fewer of the doctors in their area, while only 4% were in a plan that included more than three-quarters of the area doctors in their network.
- Some of the narrowest network plans were found in large metro counties, where enrollees on average had access to 34% of doctors through their plan networks. Marketplace enrollees in Cook County, IL (Chicago) and Lee County, FL (Fort Myers) were enrolled in some of the narrowest networks (with average physician participation rates of 14% and 23%, respectively). Plans in rural counties tended to include a larger share of the doctors in the area, though rural counties had fewer doctors overall relative to the population compared to large metro counties.
- On average, more than one-quarter (27%) of actively practicing physicians were not included in any Marketplace plan network.
- On average, Silver plans with higher shares of participating doctors had higher total premiums. Compared to plans where 25% or fewer of doctors participated in-network, those with participation rates between 25% and 50% cost 3% more while those with participation rates of more than 50% cost 8% more. (Silver plans are midlevel plans in terms of patient cost-sharing and are particularly significant because they are the benchmark for federal premium subsidies.)
- More than 4 million enrollees (37% of all enrollees) lived in a county in which the two lowest-cost Silver plans included fewer than half of the doctors in the area and a broader plan was available. In order for these enrollees to enroll in the cheapest Silver plan that included at least half the doctors, they would have needed to spend an additional $88 per month.
How Broad are Marketplace Plan Physician Networks?
On average, enrollees in the ACA Marketplaces had access to 40% of the doctors near their homes through their plan’s network. This share was similar for pediatric and non-pediatric doctors.
A quarter of enrollees were in plans where fewer than 26% of the local doctors participated in their plan’s network, while another quarter were in plans where at least 54% of local doctors participated.
There is no formal definition of what constitutes a narrow network plan. Some researchers have labeled plans covering fewer than a quarter of the physicians in an area as narrow. Under this definition, 23% of Marketplace enrollees were in a narrow network plan. About seven in ten enrollees (70%) were in a plan that included half or fewer of the doctors near their home. Only 4% of enrollees were in a plan that included at least three-quarters of local doctors, and 1% of enrollees were in a plan that included at least 85% of local doctors.
How Broad Are Plan Networks for Primary Care and Physician Specialties?
Even a plan with a relatively large share of local doctors participating in its network may not have enough doctors in different specialties to meet the needs of plan enrollees. In particular, enrollees with chronic conditions may look for plans that include their doctors across multiple specialties.
Primary Care Physicians: Marketplace enrollees, on average, had plan networks that included 43% of the primary care doctors in their area. A quarter of Marketplace enrollees had plan networks that included fewer than 25% of primary care doctors. More than half a million Marketplace enrollees were in a plan with fewer than 50 in-network primary care doctors near their homes. As is the case for physician networks overall, primary care physician networks tended to be narrower in large metro counties, where the average enrollee had a plan network that included 35% of local primary care doctors. While primary care doctors account for a smaller share of spending than specialists, they play an important role in insurers’ network design either by acting as gatekeepers to specialty care and referring patients to specialists.
Specialists: Marketplace plan networks tended to include a larger share of practicing medical and surgical specialists than primary care physicians. The average Marketplace enrollee had a plan network that included 52% of medical specialists and 53% of surgical specialists in their area; however, one-quarter of Marketplace enrollees had access to fewer than 34% of the medical specialists and 32% of the surgical specialists. On average, Marketplace enrollees had plan networks that included 21% of hospital-based physicians, which may include anesthesiologists, radiologists, pathologists, and emergency physicians.1 Information on additional specialties is available in the appendix.
Psychiatrists: Marketplace networks for psychiatrists were smaller. On average, Marketplace enrollees had access to 37% of the psychiatrists in their area through their plan.2 Twenty-five percent of Marketplace enrollees were in a plan that included 16% or fewer of the psychiatrists near their homes.
How Does Network Breadth Vary by Location?
Network breadth varied based on where plans were offered, with those in urban areas having lower physician participation rates, on average. In 2021, CMS designated county types based on their population and density; there are 78 Large Metro counties and 723 Metro counties. Most Marketplace enrollees lived in one of these urban county designations, including 38% in Large Metro counties and 48% in Metro counties.
Urban Counties: While Large Metro and Metro counties had more doctors, smaller shares of them participated in Marketplace plan networks compared to doctors in more rural areas. Marketplace enrollees in Large Metro counties, on average, had access to 34% of the doctors in their area through their plan networks, with a quarter enrolled in a plan whose network included fewer than 23% of local doctors. Marketplace enrollees in Metro counties, on average, had access to 42% of local doctors through their plan networks, while those in Rural counties, on average, had access to 52% of local doctors.
The 30 counties with the highest enrollment in the Marketplaces collectively represented 34% of all Marketplace enrollees and 21% of the U.S. population. These counties are typically urban and disproportionately in states that have not expanded Medicaid under the ACA.3
There was significant variation in network breadth across these 30 counties. Differences in average network breadth across these counties are the result of a combination of factors including the physician workforce, market characteristics, and insurer strategies. With networks with low provider participation rates, most Marketplace enrollees in Cook County, IL (Chicago) had access to fewer than one in six (14%) doctors in their area on average. Similarly, Marketplace enrollees in Lee County, FL (Fort Myers) and Fort Bend County, TX (outside Houston) had in-network access to less than a quarter of local doctors (23% and 24%, respectively). In contrast, some larger US cities had broader networks than those available in Houston and Chicago. For example, enrollees in Middlesex County, MA (outside Boston), Gwinette County, GA (outside Atlanta), and Travis County, TX (Austin) had in-network access to almost half of the doctors in their areas on average (46%, 46%, and 49%, respectively).
In 2021, 14% of Marketplace enrollees (1.6 million people) lived in four counties: Los Angeles, CA; Miami-Dade, FL; Broward, FL (Fort Lauderdale); and Harris, TX (Houston). On average, enrollees in each of these counties had in-network access to less than 4-in-10 local doctors (25%, 36%, 38%, and 25%, respectively).
High physician participation rates may not result in meaningful choice if there are few doctors in the area in the first place. For example, enrollees in Hidalgo County, TX (McAllen), on average, had access to 61% of local doctors through their plan networks, but this may have reflected chronic shortages in the number of practicing doctors in the county.4
Rural Areas: On average, Marketplace enrollees in Rural counties had access to about half (52%) of local doctors through their plan networks, higher than the average in more urban counties. The higher provider participation rates in rural areas, however, need to be considered in the context of the small number of primary care doctors and specialists practicing in these areas. For example, 2.9 million Marketplace enrollees in Rural counties had fewer than 10 dermatologists in their local area, 2.5 million had fewer than 10 gynecologists, and 1.7 million had fewer than 10 cardiologists in their plan networks. In some cases, these providers may already have full panels, and an enrollee’s choice may be even more limited than the number of physicians who accept the plan.
County Demographics: On average, Marketplace enrollees living in counties with a higher share of people of color had narrower networks than counties with a smaller share.5 The quarter of Marketplace enrollees living in the counties with the highest share of people of color had access to 34% of doctors in-network, on average, compared to 42% in counties with a smaller share of people of color. This difference may reflect the higher concentration of people of color in large metro counties, where plans typically had narrower networks.
How Much Choice Do Consumers Have Over Networks in the County Where They Live?
Provider networks vary within counties, meaning that individuals shopping for a Marketplace plan may have the option to enroll in plans with vastly different network breadths. In 2021, 70% of enrollees (nearly 8 million people) lived in a county where one or more plans covered fewer than a quarter of the doctors in the area. Among these enrollees, nearly 4.3 million (54%) also had the opportunity to enroll in a plan that included more than half the doctors in the area.
In the 30 counties with the most enrollment, enrollees could choose from about 8 distinct plan networks, on average. Even within the same county, enrollees may have access to vastly different shares of physicians in-network. For example, in Lee County, FL (Fort Myers), a quarter of Marketplace enrollees were enrolled in plans with networks that included fewer than 5% of local doctors, while a quarter were enrolled in plans with networks that included more than 45%. Similarly, in Travis County, TX (Austin), a quarter of Marketplace enrollees were enrolled in a plan with a network that included fewer than 36% of local doctors, while a quarter were enrolled in plans that included at least 70%. Consumers in these counties have the opportunity to enroll in plans with vastly different physician networks but often face higher premiums to do so. (See section “How is Network Breadth Related to Plan Premiums?” for details.)
Access to a “Broad” Network Plan: A large share of Marketplace enrollees (91%) lived in a county in 2021 where they could not choose a plan with a network that included at least 75% of doctors in their areas. Among the 30 counties with the most Marketplace enrollment, only two—Middlesex County, MA (outside Boston) and Hidalgo County, TX (McAllen)—had at least one plan network choice with a physician participation rate of 75% or more. In most cases, the broadest Marketplace plan network offered in these 30 counties was much narrower than this. For example, the physician participation rate for the broadest Marketplace plan network offered was 22% in Cook County, IL (Chicago), 38% in Hillsborough County, FL (Tampa), and 40% in Maricopa County, AZ (Phoenix). In these counties, shoppers were unable to enroll in a plan that covered at least half of the doctors in their community, even if they were willing and able to pay more.
Doctors Not Participating in Any Marketplace Network: Some doctors did not participate in any Marketplace plan network in 2021. On average, 27% of actively practicing physicians who submitted Medicare claims were not included in any Marketplace plan network offered to enrollees that year. This means that people transitioning to a Marketplace plan from another coverage source may not have been able to find any plan that included their doctor. In some counties, a much higher share of doctors did not participate in any Marketplace network, including Cook County, IL (Chicago), where 60% of doctors did not participate in any Marketplace plan networks, Dallas County, TX (36%), and Lee County, FL (Fort Myers) (41%).
How Visible Are Differences in Network Breadth to Plan Shoppers?
The difficulty of selecting an appropriate plan for a consumer’s health needs is heightened by the tremendous number of choices in many counties. The average Marketplace consumer had a choice of more than 58 plans (including 23 Silver plans) in 2021, a number that has since grown.6
Plan choices can involve different provider networks. For example, in Harris County, TX (Houston), consumers in 2021 had a choice of 87 plans that used seven different provider networks, with physician participation rates that ranged from 9% to 52%. However, these network differences are largely invisible to consumers. The lack of consumer tools to evaluate and measure plan networks can make it more challenging to choose a plan. Other than in a limited pilot operating in two states (Tennessee and Texas), the only tool available for HealthCare.gov consumers to evaluate a plan’s network is to search for individual providers, one by one, in directories, which may not always be up to date.
Further complicating the challenges of selecting plans, the marketing names of plans offered by the same insurer using different provider networks do not clearly indicate network differences. For example, AmeriHealth of New Jersey offers multiple Silver plans in Camden County, NJ. The narrow plan was marketed as “IHC Silver EPO AmeriHealth Advantage” (with a physician participation rate of 40%), while the broader network Silver plan was marketed as “IHC Silver EPO Regional Preferred” (with a physician participation rate of 74%). Based on these names, shoppers may not be able to discern that these plans had different networks with very different participation rates.
Shoppers can also search by plan type. The vast majority of Marketplace enrollees (84%) were in HMO or EPO plans in 2021, which have closed networks that generally do not cover non-emergency services provided outside of their provider network. A smaller share of Marketplace enrollees were in PPO plans (13%) and POS plans (4%), which provide some coverage for out-of-network care. The cost for such care can be quite expensive because out-of-network providers can sometimes balance bill and cost sharing for their services is typically higher and not subject to the annual out-of-pocket maximum.
Marketplace consumers seeking access to a broader choice of physicians and who have the choice of a PPO plan might assume such plan networks are analogous to the broad PPO networks offered to many in the employer market. On average in 2021, Marketplace enrollees who signed up for PPO plans had access to 53% of local doctors through their plan networks, compared to 37% for those enrolled in HMOs and 38% for those enrolled in EPO plans. However, plan type is not necessarily reflective of network breadth. In almost half (46%) of counties with both a PPO and either an HMO or EPO Marketplace plan, at least one HMO or EPO plan had a broader network than a PPO plan. Many Marketplace enrollees also did not have the option to choose a PPO plan: 60% of enrollees lived in a county in which only closed-network (HMO and/or EPO) plans were available.
Marketplace plans are categorized into metal levels based on the overall level of cost sharing required by the plans (deductibles, copays, etc.). In 2021, enrollees in Bronze, Silver, and Gold plans had access to similar shares of physicians in their areas (41%, 39%, and 44%, respectively). This is the result of issuers utilizing the same networks across metal levels within a county. In only 1% of counties did an insurer’s broadest Silver plan use a different network than its broadest Bronze plan.
HealthCare.gov has not yet widely released a consumer assistance tool to aid shoppers in filtering options by network breadth. Since 2017, CMS has operated a limited pilot with information on network breadth for consumers in Tennessee and Texas.7 Under this network transparency pilot, CMS provides measures of plan network breadth for hospitals, primary care providers, and pediatricians as an aid to Marketplace shoppers in those states. CMS calculates a participation rate by determining the share of providers participating in any Marketplace networks in the area. CMS then categorizes plan networks as “Basic” (0%-29%), “Standard” (30%-69%), or “Broad” (70%+), based on how many physicians participate in at least one QHP network. Whereas the denominator used throughout this analysis is physicians who submitted claims to Medicare, the CMS tool only considers providers that participate in Marketplace plans. Therefore, even plans with narrow networks in areas where most doctors do not participate in Marketplace plans could be labeled “standard” or “broad” using this method. For example, whereas 90% of physicians in Travis County, TX (Austin) who take Medicare participated in at least one Marketplace plan in 2021, only 64% of doctors in Dallas County, TX did. Therefore, a plan covering a quarter of all the available doctors in both counties would be considered a “basic” plan in Travis County, TX but a “standard” plan in Dallas County.
Generally, the method used in the CMS “network transparency” tool does not seem to facilitate comparing plan networks across counties and may exaggerate the breadth of plan networks, potentially leading some consumers to believe that their plan includes a larger share of local providers than it actually does. Under the CMS pilot method, only 16% of Marketplace enrollees in 2021 were enrolled in a plan that would be considered “basic”; this compares to 33% of Marketplace enrollees would be considered to be in a basic plan if the definition of local doctors used in this paper were applied.
Network Breadth by Plan Insurer
Marketplace shoppers may consider who the insurer is when making inferences about plan networks.
Blue Cross and/or Blue Shield (BCBS) plans are sponsored by a mixture of for-profit and tax-exempt insurers. While these companies are run independently, they are affiliated through an association, and many share a common heritage. In many states, the BCBS affiliates are the largest insurers participating in the Marketplace and may in some cases also be the largest insurers or administrators for employer-sponsored coverage as well. On average, enrollees in BCBS Marketplace plans in 2021 had access to 49% of doctors in their areas through their plan networks, a larger share than enrollees in plans offered by other insurers (35%).8 Even so, BCBS Marketplace plan networks, on average, excluded about half of the doctors available to those in traditional Medicare. Further, there was considerable variation in participation rates by doctors among plans sponsored by BCBS insurers, sometimes even within the same county. For example, in Wayne County, MI (Detroit), the Blue Care Network and Blue Cross/BlueShield plan network participation rates ranged from 20% to 59% across plan options. Similarly, in Camden County, NJ, Independence Blue Cross offered two networks, with physician participation rates of 40% and 74%. Florida Blue in Miami-Dade County, FL offered multiple plan networks with participation rates ranging from 25% to 51%.
Insurers Also Participating in Medicaid Managed Care: Insurers with a large presence in the Medicaid managed care organization (MCO) market also have a solid footprint in the Marketplaces. Overall, the breadth of Marketplace plan networks sponsored by MCO insurers was similar to that of insurers overall (41% vs. 40%, respectively).9 One of the largest MCOs that expanded into the Marketplaces is Centene Corporation, which sponsors plans under Ambetter, Health Net, and other brand names. The average participation rate for doctors in plan networks offered by Centene was lower than the overall Marketplace average (33% vs. 40%). Molina, another major MCO insurer offering Marketplace plans, had an average physician participation rate of 35% in its plan networks.
Integrated Delivery Systems: Integrated delivery systems, such as Kaiser Permanente, Geisinger Health Plan, and the Chinese Community Health Plan, institute a different approach to network design. Under these plans, health care financing and delivery are conducted by the same organization. Providers are typically employees of the plan or an affiliated medical group, and these plans generally do not cover non-emergency care provided by doctors outside of the network. Although enrollees in these plans may not have a wide choice of physicians in the area, these integrated models strive to improve access through care coordination and may be less complex for patients to navigate which providers are in and out of their networks. Enrollees in Kaiser plans, by far the largest integrated delivery system, on average, had access to about one in five (19%) doctors in their area. Of note, the breadth of Kaiser physician networks does not lower the overall Marketplace average substantially because only 7% of Marketplace enrollees nationally were enrolled in Kaiser plans.
Non-profit Insurers: On average, Marketplace enrollees covered by plans sponsored by non-profit insurers in 2021 had in-network access to 43% of the doctors in their areas, compared to 38% for those covered by for-profit insurers. Excluding enrollees in Kaiser health plans, enrollees covered by non-profit insurers had access to 47% of local doctors on an in-network basis on average.
How is Network Breadth Related to Plan Premiums?
On average, Silver plans with higher shares of participating doctors had higher total premiums. When compared to plans where fewer than 25% of doctors participated in-network, those with participation rates between 25% and 50% cost 3% more while those with participation rates of more than 50% cost 8% more. While other factors also contribute to plan premiums, including the breadth of hospital networks and the plan design, narrow physician networks were associated with meaningfully lower total costs. The average total premium for a 40-year-old enrolled in a Silver Marketplace plan in 2021 was $466 a month. For these enrollees to sign up for a Silver plan that included more than 50% of area physicians, their premiums would have increased $37 per month. The statistical model used to estimate these premium differences is described in the methods.
Enrollee Cost to Purchase a Broader Plan
Consumers with private health insurance generally consider the breadth of provider networks very important when choosing a plan, yet many remain price-sensitive when selecting plans with higher costs. A 2019 KFF/LA Times survey found that 36% of adults with employer coverage said the cost of the plan (premiums and cost sharing) was the main reason they chose their plan, while 20% cited the choice of providers.
One way to illustrate how the cost of broader plans is passed on to consumers is to consider the counties where enrollees face higher premiums for a broader plan. Most (90%) of Marketplace enrollees receive a tax credit to offset all or part of the cost of the monthly premium. The size of the premium tax credit available to enrollees is based on both household income and the cost of the benchmark plan, defined as the second-lowest-cost Silver plan. ACA enrollees are responsible for paying the entire amount between the cost of the benchmark plan and a higher-cost plan. Enrollees in counties where the benchmark plans have relatively low physician participation rates may need to pay a significant amount to enroll in a broad network plan.
Among Marketplace enrollees, 74% percent, or 8.5 million enrollees, were in a county where the two lowest-cost Silver plans had fewer than 50% of physicians participating in their networks. Of these, about half, or 4.3 million enrollees, did not have a Silver plan available to them that included at least half of the local physicians in its network; 4.2 million enrollees did have at least one such plan available to them. For those 4.2 million people, the average additional cost to enroll in a Silver plan with at least half the local doctors participating was $88 (for a 40-year-old).
One in five Marketplace enrollees (19%, or 2 million enrollees) lived in a county where the two lowest-cost Silver plans included fewer than 25% of local physicians in-network. Fifty percent of these enrollees, or 1 million enrollees, lived in a county where at least one plan included at least half the doctors. Among these enrollees, the cost to enroll in a plan with at least half the local doctors would have cost $95 more than the benchmark plan each month.
Implications for Consumers and Potential Federal Efforts to Increase Access to Care
Having a plan with a narrow network increases the chances that an enrollee receives care out-of-network, either inadvertently (e.g., receiving care from an out-of-network provider they did not choose at an in-network facility), or because they are unable to find an in-network physician at the time and place they need. It can also have consequences for enrollees’ ability to seek care in a timely fashion and their health. The 2023 KFF Survey of Consumer Experiences with Health Insurance found that 20% of adults with Marketplace coverage said that in the past year, a particular doctor or hospital they needed was not covered by their insurance. Among Marketplace enrollees who experienced this problem, 34% said that needed care was delayed, 34% said they were unable to get needed care, and 25% experienced a decline in health status.
Additionally, going out-of-network can be costly for enrollees. Enrollees using out-of-network providers may face higher cost sharing and balance billing if the services provided are not regulated by the No Surprises Act. Among those who indicated experiencing a network adequacy problem in the consumer survey, almost half (47%) said they ended up paying more out of pocket for care than expected, including 22% who said the additional cost was $500 or more.
Some have suggested that the design of the Marketplace encourages insurers to offer narrower networks compared to those included in employer plans in order to keep premiums down. Employers use health benefits to attract and retain workers and have an incentive to create broader networks that appeal to their workforce. One analysis found that primary care networks for large group plans were 25% larger than those found on the Marketplaces.10 The higher prevalence of narrow network plans corresponds to a greater share of enrollees facing challenges finding in-network providers. The 2023 KFF Survey of Consumer Experiences with Health Insurance found that adults with Marketplace coverage were more likely than those with employer-sponsored health insurance to report that a particular doctor or hospital they needed was not covered by their insurance (20% vs. 13%) (Figure 14). Additionally, 34% of Marketplace enrollees in fair or poor health reported that a particular doctor or hospital they needed was not covered by their plan, nearly two times more than those with an employer plan (16%). Similarly, a forthcoming KFF analysis of the 2022 National Health Interview Survey found that challenges finding doctors led some adults to delay or skip care (Appendix Figure 7). Those with non-group coverage, such as Marketplace plans, were twice as likely as those with employer plans to indicate that they had delayed or skipped care in the past year because they couldn’t find a doctor who accepted their plan (7% vs. 3%). Among those who visited a hospital or emergency room during the past year, 11% of non-group enrollees reported skipping or delaying care, compared to 5% of those with employer coverage.
Even still, network breadth is only one component of access to care and may not always gauge how well enrollees are served. There are many aspects consumers consider when selecting a plan. This analysis examines network breadth but does not address other standards that health plans, physician networks, and physicians are required to meet. Enrollees in plans with broad networks may still face challenges scheduling appointments and considerable wait times. For some specialties, such as psychiatry, workforce shortages make it hard for enrollees to find providers even in plans that include a broad swath of physicians. Workforce shortages in many rural areas mean that even if a plan has a broad provider network, there still may be an insufficient number of providers to meet the needs of that community. Furthermore, many enrollees face additional challenges using their plan, including stringent prior authorization requirements.
Similarly, a plan with a narrow network—measured as the share of physicians in the area participating—may still provide adequate access to care, just not necessarily with a broad choice of providers. States use a range of network adequacy rules, with many requiring the inclusion of different types of providers, but only ten evaluate wait times to determine if a network meets minimum standards. The ACA requires that Marketplace plans maintain networks sufficient in number and types of providers for the purpose of ensuring that all services will be accessible without unreasonable delay. Currently, federal network adequacy standards require that plans provide access to at least one in-network provider for 90% of plan enrollees living within certain time/distance thresholds (for example, in large metro areas, no more than 10 minutes or 5 miles from a primary care provider, or no more than 30 minutes or 10 miles from an oncologist.) Although these standards measure geographic proximity to in-network care, they do not measure network breadth. Additionally, starting in 2025, federal Marketplace plans will be required to meet maximum appointment wait-time standards (e.g., no more than a 15-calendar day wait for routine primary care appointments or 30 days for non-urgent specialty care appointments).
A central challenge in analyzing network breadth is the quality of available data. The inclusion of so-called “phantom providers”—physicians listed in the network but who are not actually available to plan enrollees at the location or in the specialty they are listed—may increase the apparent breadth of plan networks without actually increasing access to care. Federal laws and regulations require Marketplace plans to publish online an up-to-date and complete provider directory. However, CMS has found high rates of incomplete and inaccurate information in these directories. Additionally, the No Surprises Act Improvements in plan directory data would facilitate regulation and decrease the burden on consumers comparing and using the plan. In 2022, CMS solicited public comment on establishing a national provider directory that private plans could use as a database for their own plan directories. Further action on this proposal is still pending, but this could improve available information about the landscape of available providers, allowing for the development of improved consumer information about provider ratios that show the share of practicing area providers (overall and by specialty) included in the provider network of each QHP.


Leave a comment